Better Period Separators MT5
- インディケータ
- Zhi Wen Software Development
- バージョン: 1.0
Better Period Separators For MetaTrader 5
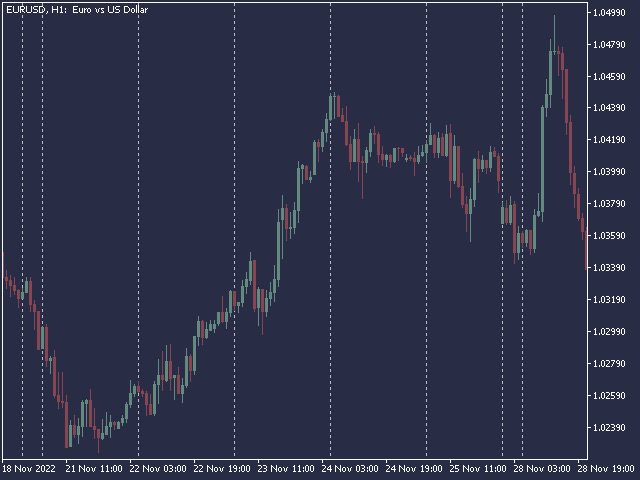
The built-in period separators feature doesn’t allow users to specify the time period, so you can use this indicator to create more customizable period separators.
On intraday charts, you could place period separators at a specific time, you could also place extra period separators at a specific time on Monday to mark the start of a week.
On higher timeframe charts, this indicator works the same as the built-in period separators,
On the daily chart, period separators are placed at the start day of every month.
On the weekly and monthly charts, period separators are placed at the start day of every year.
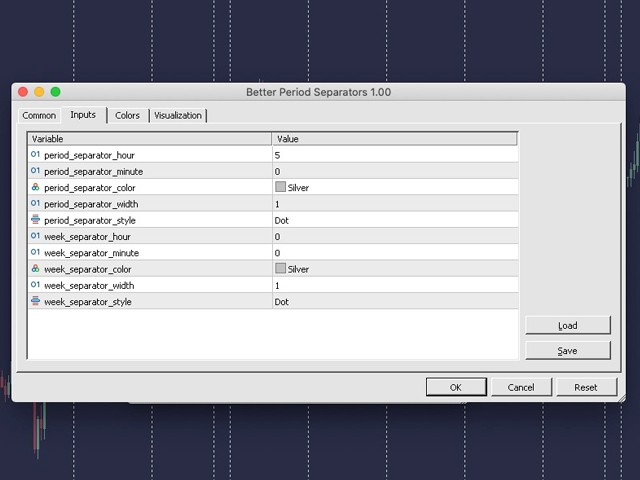
Inputs
- period_separator_hour
- period_separator_minute
- period_separator_color
- period_separator_width
- period_separator_style
- week_separator_hour
- week_separator_minute
- week_separator_color
- week_separator_width
- week_separator_style
MT4 version: https://www.mql5.com/en/market/product/91676

Thanks for this awesome indicator