Pivot Points Daily
- インディケータ
- Davide Zunino
- バージョン: 1.3
- アップデート済み: 21 1月 2023
- アクティベーション: 5
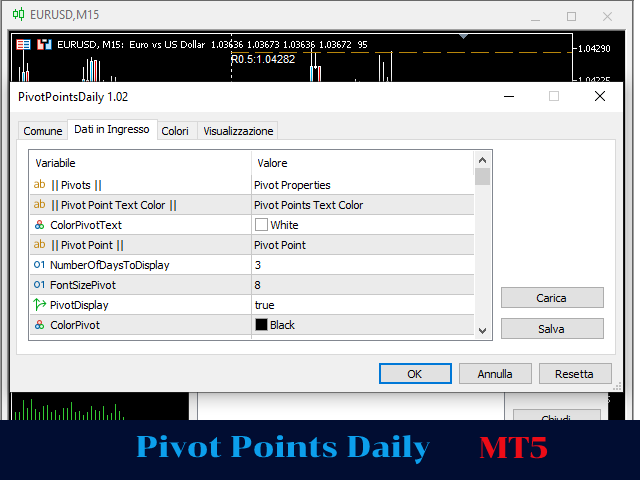
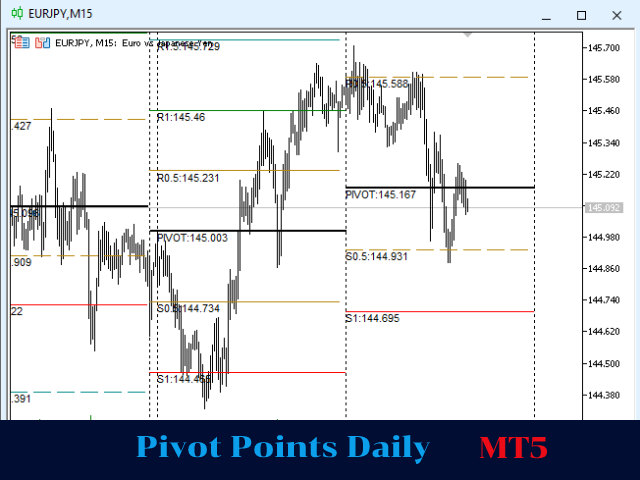
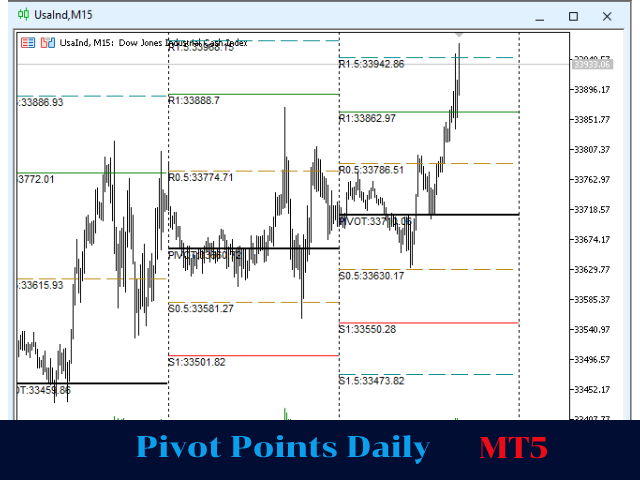
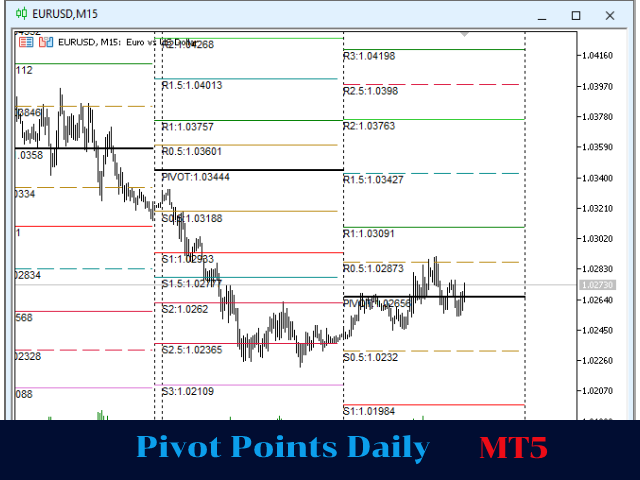
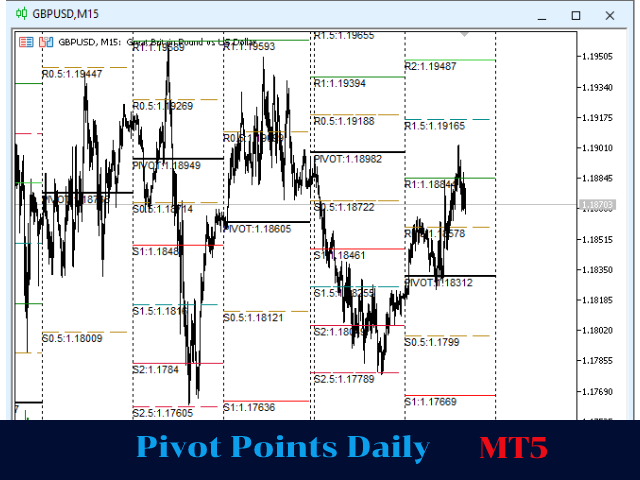
The Indicator show Daily Pivot Points. It is possible to specify the number of days to display. For forex it doesn't consider the sunday session data. It is possibile to modify the color, style and width for every level. It is better to use this indicator with timeframe not higher than Н1. 4 Levels of support and resistance with also Intermediate Levels that is possible to hide.


ユーザーは評価に対して何もコメントを残しませんでした