The BooBIE Trap Impulse Entry
- インディケータ
- Andre Matthes
- バージョン: 1.2
- アクティベーション: 5
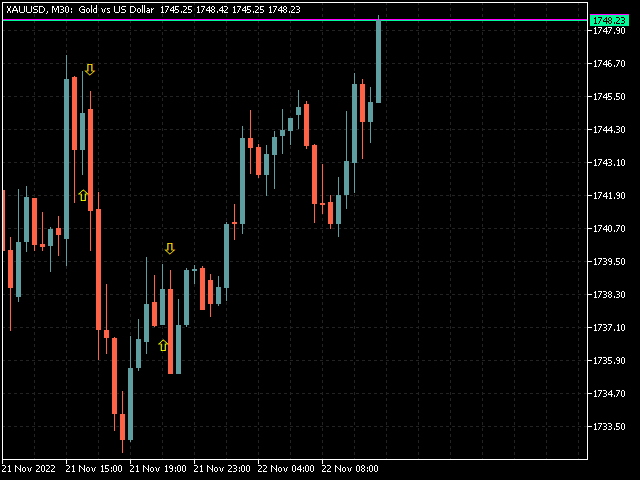
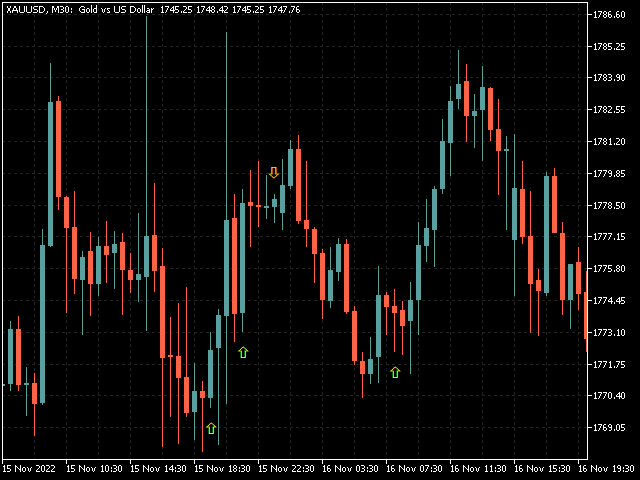
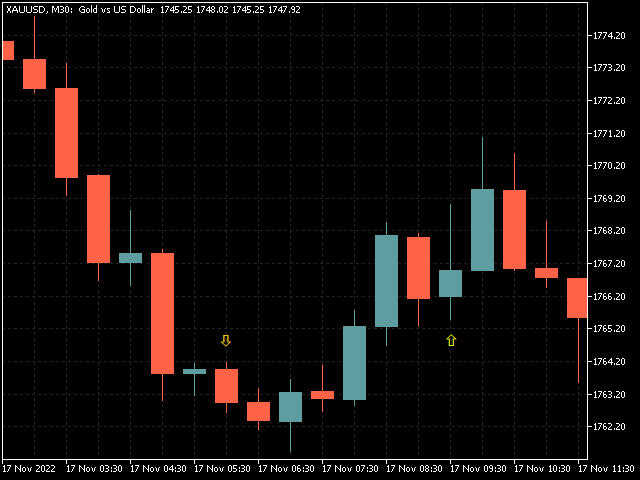
- simple Price Action Indicator - a 3 Candle Pattern (1. Direction-Candle / 2. the TRAP / 3. Trigger-Candle)
BUT every Signal needs ATTENTION to check for a clean Range
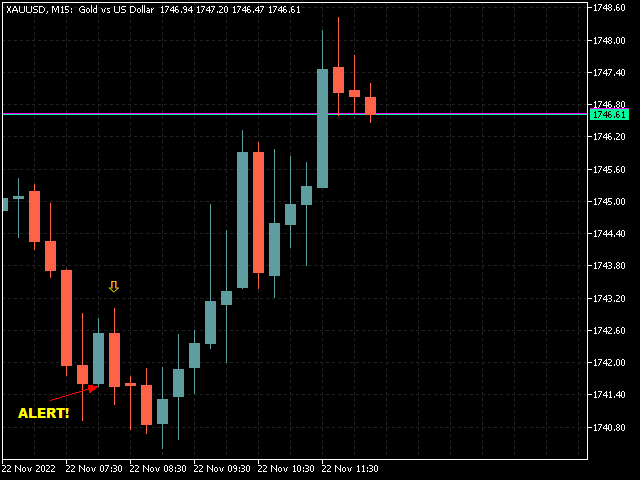
- NON Lagging ! the Alert shows instantly whats happening
- recommended SETUP is:
- there is a VOLUME-Filter (in points for the 1. candle) to avoid alerts with tiny Candles during a NON-VOLUME-Time
- 10% off the Boobietrap-Candle as the ALERT-Level --> can easily be adjusted - user defined
- recommended Timeframe: M30 (we strictly recommend M30 ONLY!) M15 is OK --- or the M5 TF for SCALPING
HOW to trade:
1. wait for the ALERT --> occours when the Trigger Candle exceeds the Trap-Candle
1.1 check if there is CLEAN RANGE to the LEFT !!
2. wait for the M5 candle to close! OR: as a real IMPULSE ENTRY --> execute right now + SL below/above the current candle
3. execute when PRICE exceeds that M5 candle / when PRICE exceeds the 1. Candle (depends on your Setup)
SAFE Scenerio: Execute ONLY when Price exceeds the 1. Candle (Direction-Candle) !