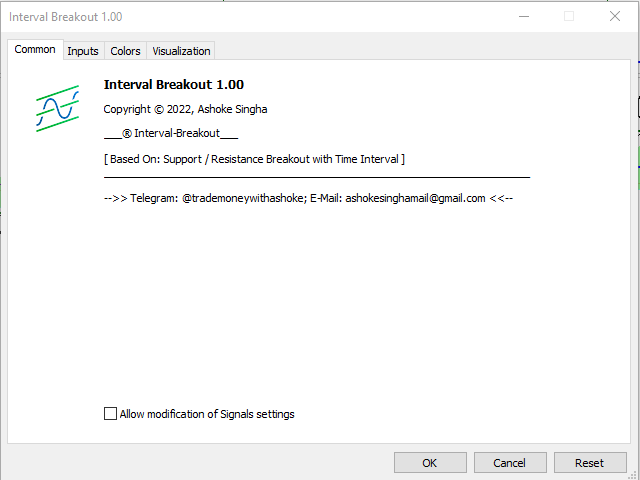
• 概要
  • レビュー
  • コメント

Interval Breakout

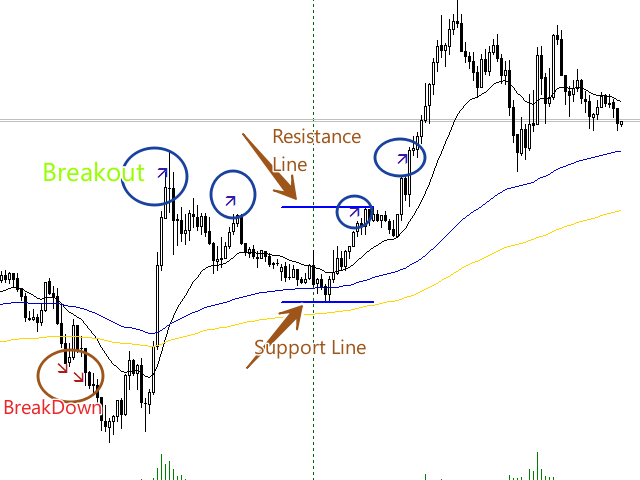
Interval Breakout (IB)

is a Breakout Indicator Mixing with Time Interval.


We can set a Particular Time and Support / Resistance Line Length for a Breakout Scanning.

This is strongly recommended to:

  1. Check the Video properly to understand the Indicator setup, how does it work and exactly how to take Entries and Exit according to this Indicator.
  2. Give preference to Support / Resistance zone to get rid of False signal.

Steps to Setup the Indicator:

✪ Install the Custom Indicator;

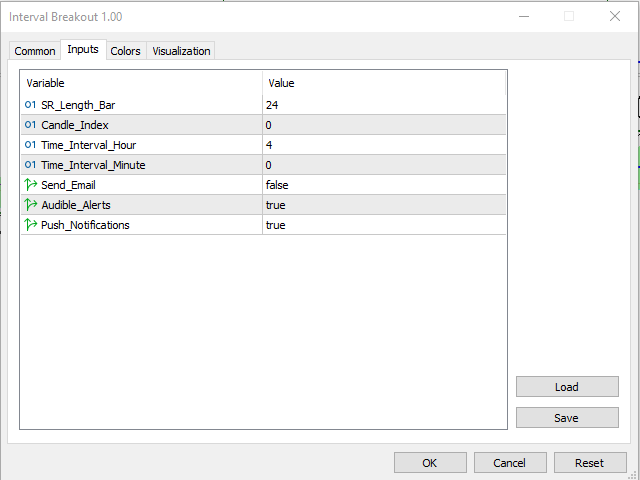
✪ Set all the Parameters as discussed in the video;

✪ Set "SR_Length_Bar" , "Time_Interval (Hour/Minute)" etc.;

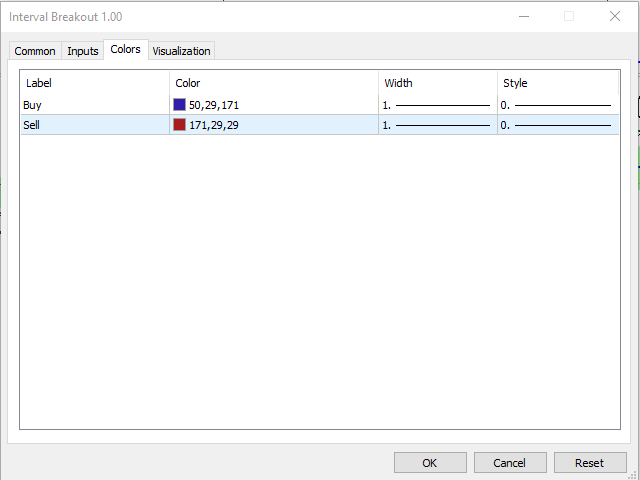
✪ Set Arrow Color, Width;

DONE👍


It can be used for:

  • All Pairs: Forex, Cryptocurrencies, Metals, Stocks, Indices. 
  • All Timeframe
  • All Brokers
  • All type of Trading Style like Scalping, Swing, Intraday, Short-Term, Long-Term etc.
  • Multiple Chart

This Indicator is based on Price Action, S/R Breakout with Specific Time Interval.


--->>!! MT4 version will Launch very shortly !!<<---


It will provide pretty accurate Trading signals to be ready for an Entry.


Notification Setting: All type of notifications and Pop-Up available with this Indicator. (Can manually ON/OFF the notification as per requirements.)


-->> For any Type of Support, Guidance, Setup Issue, EA Optimization, Input Setup etc. etc. can Contact me..

Support Group--->> https://www.mql5.com/en/messages/030709F84DE2D801


おすすめのプロダクト
Best SAR MT5
Ashkan Hazegh Nikrou
5 (1)
説明 :  外国為替市場(PSAR)で専門的で人気のあるインジケーターの1つに基づいた新しい無料インジケーターをご紹介します。このインジケーターは元のパラボリックSARインジケーターの新しい変更です。プロSARインジケーターでは、ドットと価格チャートのクロスオーバーを見ることができます。クロスオーバーはシグナルではありませんが、動きの終わりの可能性について話します。新しい青いドットで購入を開始し、最初の青いドットの1 atr前にストップロスを配置し、最後にドットが価格チャートを横切るとすぐに終了できます。 売買シグナルを開く方法は? 最初の青い点によるオープンバイトレードと最初の赤いドットによるオープンセルトレード 正しいストップロスはどこにありますか? 安全なストップロスは最初のドットにある可能性があります(最初の青いドットの買いの場合と最初の赤い点の売りの場合) 正しいテイクプロフィットはどこにありますか? テイクプロフィットはストップロス距離とRRに基づいて調整できるので、私の提案は2 RRで、ストップロスの2倍です。 利益を上げているのにtpを達成でき
FREE
Introduction The Bounce Zone indicator is a cutting-edge non-repainting technical tool built to identify key areas on the price chart where market sentiment is likely to cause a significant price reversal. Using advanced algorithms and historical price data analysis, this indicator pinpoints potential bounce zones. Combined with other entry signal, this indicator can help forex traders place the best trades possible Signal A possible buy signal is generated when price is in the green zo
FREE
Tired of plotting trendlines? The PZ TrendLines MT5 indicator applies a mechanical approach to the construction of trend lines for you!  [ Installation Guide | Update Guide | Troubleshooting | FAQ | All Products ] It can draw up to 18 trendlines Trendlines can be optionally based on fractals Each line represents a breakout level Each trendline can be broken or rejected Configurable amount of lines Configurable colors Support I am happy to provide free products but given my limited time, they com
FREE
トレンドキャッチャー: アラートインジケーター付きのトレンドキャッチャーストラテジーは、市場トレンドやポテンシャルなエントリーポイントやエグジットポイントを特定するのに役立つ多目的な技術分析ツールです。動的なトレンドキャッチャーストラテジーを備えており、市場状況に適応してトレンドの方向を明確に視覚化します。トレーダーは、自身の好みやリスク許容度に合わせてパラメーターをカスタマイズできます。このインジケーターはトレンドの識別を支援し、ポテンシャルなリバーサルをシグナルし、トレイリングストップのメカニズムとして機能し、市場への迅速な対応のためのリアルタイムアラートを提供します。 特徴: - トレンドの識別:上昇トレンドと下降トレンドをシグナルします。 - トレンドのリバーサル:ローソク足の色が上昇から下降に変わった場合やその逆の場合に、ポテンシャルなリバーサルを警告します。 - リアルタイムアラート:新しいトレンドの識別に対するアラートを生成します。 推奨事項: - 通貨ペア:EURUSD、AUDUSD、XAUUSDなど... - タイムフレーム:H1。 - アカウン
FREE
Cybertrade Keltner Channels - MT5 Created by Chester Keltner, this is a volatility indicator used by technical analysis. It is possible to follow the trend of financial asset prices and generate support and resistance patterns. In addition, envelopes are a way of tracking volatility in order to identify opportunities to buy and sell these assets. It works on periods longer than the period visible on the chart. All values ​​are available in the form of buffers to simplify possible automations.
FREE
Tops & Bottoms Indicator FREE   Tops abd Bottoms:   An effective indicator for your trades The tops and bottoms indicator helps you to find  ascending and descending channel formations with indications of ascending and/or descending tops and bottoms. In addition, it  show possibles  opportunities with a small yellow circle when the indicator encounters an impulse formation. This indicator provide to you  more security and speed in making entry decisions. Also test our FREE advisor indicator:
FREE
The Penta-O is a 6-point retracement harmonacci pattern which usually precedes big market movements. Penta-O patterns can expand and repaint quite a bit. To make things easier this indicator implements a twist: it waits for a donchian breakout in the right direction before signaling the trade. The end result is an otherwise repainting indicator with a very reliable trading signal. The donchian breakout period is entered as an input. [ Installation Guide | Update Guide | Troubleshooting | FAQ | A
FREE
Free automatic Fibonacci is an indicator that automatically plots a Fibonacci retracement based on the number of bars you select on the BarsToScan setting in the indicator. The Fibonacci is automatically updated in real time as new highest and lowest values appears amongst the selected bars. You can select which level values to be displayed in the indicator settings. You can also select the color of the levels thus enabling the trader to be able to attach the indicator several times with differe
FREE
ピボットポイントフィボRSJは、フィボナッチレートを使用してその日のサポートラインとレジスタンスラインを追跡するインジケーターです。 この壮大な指標は、フィボナッチレートを使用してピボットポイントを通じて最大7レベルのサポートとレジスタンスを作成します。 価格がこのサポートとレジスタンスの各レベルを尊重する方法は素晴らしいです。そこでは、オペレーションの可能な入口/出口ポイントを認識することができます。 特徴 最大7レベルのサポートと7レベルの抵抗 レベルの色を個別に設定します 入力 ピボットタイプ ピボットフィボRSJ1 =フィボ比1の計算 ピボットフィボRSJ2 =フィボ比2の計算 ピボットフィボRSJ3 =フィボ比3の計算 ピボットフィボクラシック=クラシックピボット計算 最小ピボットレベル ピボット3レベル ピボット4レベル ピボット5レベル ピボット6レベル ピボット7レベル それでも質問がある場合は、ダイレクトメッセージで私に連絡してください: https://www.mql5.com/ja/users/robsjunqueira/
FREE
What is this indicator? このインジケーターはMT5のFX検証ソフト「 Knots Compositor 」の 全てのチャートモードに対応したストキャスティクス です。 どのチャートモードでも、 チャートに表示されているローソク足で計算して表示します 。 KC-Indicators -   KC-MA   (移動平均線) -   KC-ENV   (エンベロープ) -   KC-BB   (ボリンジャーバンド) -   KC-ADX   (Average Directional Movement Index) -   KC-MACD   (Moving Average Convergence/Divergence) -   KC-RSI   (Relative Strength Index) -   KC-STOCH   (ストキャスティクス)
FREE
Spike Catch Pro 22:03 release updates Advanced engine for searching trade entries in all Boom and Crash pairs (300,500 and 1000) Programmed strategies improvements Mx_Spikes (to combine Mxd,Mxc and Mxe), Tx_Spikes,   RegularSpikes,   Litho_System,   Dx_System,   Md_System,   MaCross,   Omx_Entry(OP),  Atx1_Spikes(OP),   Oxc_Retracement (AT),M_PullBack(AT) we have added an arrow on strategy identification, this will help also in the visual manual backtesting of the included strategies and see h
FREE
This indicator is designed to detect high probability reversal patterns: Double Tops/Bottoms with fake breakouts . This is the FREE version of the indicator: https://www.mql5.com/en/market/product/29957 The free version works only on EURUSD and GBPUSD! Double top and bottom patterns are chart patterns that occur when the trading instrument moves in a similar pattern to the letter "W" (double bottom) or "M" (double top). The patterns usually occur at the end of a trend and are used to signal tren
FREE
Santa Donchian
Marco Aurelio Cestari
4.17 (6)
Santa Donchian Indicator  is an efficient way to detect support, resistence and break outs in any market. The Donchian channel measures the high and the low of a previously defined range.  Typically, a trader would look for a well-defined range and then wait for the price to break out to either one side for a trade entry trigger. Advantages Never repaints, never backpaints, never recalculates. Works in all symbols and all timeframes. Perfect trend filter for any strategy or expert advisor. Fu
FREE
This indicator is an automated version of the Fibonacci retracement (Fib) indicator. Deciding the best areas to use when drawing the fib can be tricky and this  indicator was made with that in mind. When you drop it on the chart it will automatically choose the best points to draw the fib with, but in case you aren't satisfied with those regions, you can adjust it as you wish.
FREE
Forex Indicator Arrows is an arrow Indicator used as an assistant tool for your trading strategy. The indicator analyzes the standard deviation of bar close for a given period and generates a buy or sell signals if the deviation increases. It good to combo with Martingale EA to follow Trend and Sellect Buy Only/Sell Only for EA work Semi-Automatic. You can use this  Indicator with any EAs in my Products.
FREE
Follow The Line MT5
Oliver Gideon Amofa Appiah
4.4 (30)
This indicator obeys the popular maxim that: "THE TREND IS YOUR FRIEND" It paints a GREEN line for BUY and also paints a RED line for SELL. (you can change the colors). It gives alarms and alerts of all kinds. IT DOES NOT REPAINT and can be used for all currency pairs and timeframes. Yes, as easy and simple as that. Even a newbie can use it to make great and reliable trades. NB: For best results, get my other premium indicators for more powerful and reliable signals. Get them here: https://www.m
FREE
Daily session open lines shows the traders three important trading session opens. By default it is set up to show you: Zero GMT Open Line London Open Session Line New York Open Session Line The default times are set according to GMT+2 and as such you are able to change and customise according to your specific time zone. The Indicator is usefull specially for the trader who trades the London and NewYork sessions.
FREE
価格波形パターン MT5へようこそ --(ABCD パターン)-- ABCD パターンは、テクニカル分析の世界で強力で広く使用されている取引パターンです。 これは、トレーダーが市場での潜在的な売買機会を特定するために使用する調和的な価格パターンです。 ABCD パターンを使用すると、トレーダーは潜在的な価格変動を予測し、いつ取引を開始および終了するかについて十分な情報に基づいた決定を下すことができます。 EA バージョン:     Price Wave   EA MT5 MT4バージョン:   Price Wave Pattern MT4 特徴 :  ABCDパターンの自動検出。 強気パターンと弱気パターン。  任意のシンボルと任意の時間枠で機能します。 主要なレベルと価格目標。 カスタマイズ可能な設定と繊維レベルの調整。 アラートと通知。 今後  さらに多くの 機能が追加される  予定です 。
FREE
Are you tired of drawing trendlines every time you're analyzing charts? Or perhaps you would like more consistency in your technical analysis. Then this is for you. This indicator will draw trend lines automatically when dropped on a chart. How it works Works similar to standard deviation channel found on mt4 and mt5. It has 2 parameters: 1. Starting Bar 2. Number of bars for calculation The   starting bar   is the bar which drawing of the trend lines will begin, while the   number of bars for c
FREE
BUY INDICATOR AND GET EA FOR FREE AS A BONUS + SOME OTHER GIFTS! ITALO LEVELS INDICATOR  is the best levels indicator ever created, and why is that? Using high volume zones on the market and Fibonacci the Indicator works on all time-frames and assets, indicator built after 7 years of experience on forex and many other markets. You know many levels indicators around the internet are not complete, does not help, and it's difficult to trade, but the   Italo Levels Indicator is different , the Ital
チャート上にフィボナッチレベルを手動で描画することにうんざりしていませんか?取引における主要なサポートとレジスタンスのレベルを特定する便利で効率的な方法をお探しですか?これ以上探さない! 自動 フィボナッチ レベル を実行する究極の MetaTrader 5 インジケーターである DrawFib Pro の紹介   チャート上に描画し、これらのレベルを突破したときにタイムリーにアラートを提供します。 DrawFib Pro を使用すると、取引戦略を強化し、時間を節約し、より多くの情報に基づいた意思決定を行うことができます。 私のフィボナッチベースのインジケーター:   Advanced Gartley Pattern MT5   ||    Price Wave Pattern MT5 主な特徴: 自動 フィボナッチ描画. カスタマイズ可能な パラメータ . 正確 で 信頼性. リアルタイム アラート. ユーザー フレンドリーな インターフェイス . DrawFib Pro は、チャート上でフィボナッチを自動描画するための効率的で信頼性が高く、使いやすい方法を求めるトレーダーにとって
FREE
Necessary for traders: tools and indicators Waves automatically calculate indicators, channel trend trading Perfect trend-wave automatic calculation channel calculation , MT4 Perfect trend-wave automatic calculation channel calculation , MT5 Local Trading copying Easy And Fast Copy , MT4 Easy And Fast Copy , MT5 Local Trading copying For DEMO Easy And Fast Copy , MT4 DEMO Easy And Fast Copy , MT5 DEMO The homeopathic indicator is also called the CCI indicator. The CCI indicator was propos
FREE
Necessary for traders: tools and indicators Waves automatically calculate indicators, channel trend trading Perfect trend-wave automatic calculation channel calculation , MT4 Perfect trend-wave automatic calculation channel calculation , MT5 Local Trading copying Easy And Fast Copy , MT4 Easy And Fast Copy , MT5 Local Trading copying For DEMO Easy And Fast Copy , MT4 DEMO Easy And Fast Copy , MT5 DEMO Fibo: from KTrade 1. Automatically calculate and analyze the band. -> Get the desired band 2.
FREE
Necessary for traders: tools and indicators Waves automatically calculate indicators, channel trend trading Perfect trend-wave automatic calculation channel calculation , MT4 Perfect trend-wave automatic calculation channel calculation , MT5 Local Trading copying Easy And Fast Copy , MT4 Easy And Fast Copy , MT5 Local Trading copying For DEMO Easy And Fast Copy , MT4 DEMO Easy And Fast Copy , MT5 DEMO 高度なボリンジャーバンド: 1.ボリンジャーレールは方向によって色が変わります」 2.ボリンジャーアウターレールの伸縮はアウターレールの色の変化でマークされます。」 3.ボリンジャ
FREE
What is this indicator? このインジケーターはMT5のFX検証ソフト「 Knots Compositor 」の 全てのチャートモードに対応したMACD です。 どのチャートモードでも、 チャートに表示されているローソク足で計算して表示します 。 Types of the applied price - Close - Open - High - Low - Median Price (HL/2) - Typical Price (HLC/3) - Weighted Price (HLCC/4) KC-Indicators -   KC-MA   (移動平均線) -   KC-ENV   (エンベロープ) -   KC-BB   (ボリンジャーバンド) -   KC-ADX   (Average Directional Movement Index) -   KC-MACD   (Moving Average Convergence/Divergence) -   KC-RSI   (Relative Strength Index) -   KC-S
FREE
Necessary for traders: tools and indicators Waves automatically calculate indicators, channel trend trading Perfect trend-wave automatic calculation channel calculation , MT4 Perfect trend-wave automatic calculation channel calculation , MT5 Local Trading copying Easy And Fast Copy , MT4 Easy And Fast Copy , MT5 Local Trading copying For DEMO Easy And Fast Copy , MT4 DEMO Easy And Fast Copy , MT5 DEMO Can set the cycle for other varieties of K line graph covered this window, fluctuations obse
FREE
Value Chart Candlesticks
Flavio Javier Jarabeck
4.67 (9)
The idea of a Value Chart indicator was presented in the very good book I read back in 2020 , " Dynamic Trading Indicators: Winning with Value Charts and Price Action Profile ", from the authors Mark Helweg and David Stendahl. The idea is simple and the result is pure genius: Present candlestick Price analysis in a detrended way! HOW TO READ THIS INDICATOR Look for Overbought and Oversold levels. Of course, you will need to test the settings a lot to find the "correct" one for your approach.
FREE
インディケータはチャート上にラウンドレベルを示します。 それらは、心理的、銀行的、または主要なプレーヤーレベルとも呼ばれます。 これらのレベルでは、強気と弱気の間に真の戦いがあり、多くの注文が蓄積され、ボラティリティの増加につながります。 インジケーターは、任意の楽器と時間枠に自動的に調整されます。 レベル80を突破してテストすると、購入します。レベル20を突破してテストすると、販売されます。ターゲットは00です。 注意。強力なサポートとレジスタンスレベルのため、価格は00レベルをわずかに下回る可能性があります。 入力パラメータ 。 Bars Count - 線の長さ 。 Show 00 Levels - 00レベルを表示するかしないか 。 Show 10, 90 Levels 。 Show 20, 80 Levels 。 Show 30, 70 Levels 。 Show 40, 60 Levels 。 Show 50 Levels 。 N Lines - チャートのレベル数を制限するパラメーター 。 Distance 00 Levels - レベル間の距離(自動または手動
FREE
This indicator displays pivot points in the chart, including historical vales, and supports many calculation modes for Pivot Points and S/R levels. [ Installation Guide | Update Guide | Troubleshooting | FAQ | All Products ] It plots historical levels for backtesting purposes It allows you to select the reference timeframe It implements different Pivot Point calculation modes It implements different SR calculation modes It implements customizable colors and sizes Calculation Modes The indi
FREE
このプロダクトを購入した人は以下も購入しています
まず第一に、このトレーディングシステムがノンリペイント、ノンリドロー、ノンラグのインジケーターであることを強調する価値がある。これにより、手動取引とロボット取引の両方に理想的なものになっています。 「スマートトレンドトレーディングシステム MT5」は、新規および経験豊富なトレーダー向けにカスタマイズされた包括的なトレーディングソリューションです。10以上のプレミアムインジケーターを組み合わせ、7つ以上の堅実なトレーディング戦略を備えており、多様な市場状況に対応する多目的な選択肢となっています。 トレンドフォロー戦略:トレンドを効果的に乗り越えるための正確なエントリーとストップロス管理を提供します。 リバーサル戦略:潜在的なトレンドの反転を特定し、トレーダーがレンジ相場を活用できるようにします。 スキャルピング戦略:高速で正確なデイトレードおよび短期取引のために設計されています。 安定性:すべてのインジケーターはノンリペイント、ノンリドロー、ノンラグであり、信頼性の高いシグナルを保証します。 カスタマイズ:個々の取引の嗜好に合わせたカスタム戦略をサポートします。7つ以上の戦略と組み合わせ
まず第一に、この取引インジケーターは再描画されず、再描画されず、遅延しないことを強調する価値があります。これにより、手動取引とロボット取引の両方に理想的なものになります。 アトミックアナリストは、価格の強さとモメンタムを利用して市場でより良いエッジを見つけるためのPA価格アクションインジケーターです。ノイズや誤ったシグナルを除去し、取引ポテンシャルを高めるための高度なフィルターを備えています。複雑なインジケーターの複数のレイヤーを使用して、アトミックアナリストはチャートをスキャンし、複雑な数学的計算をシンプルなシグナルと色に変換します。これにより、どのような初心者トレーダーでも理解して使用し、一貫した取引の決定を行うことができます。 「アトミックアナリスト」は、新規および経験豊富なトレーダー向けにカスタマイズされた包括的な取引ソリューションです。プレミアムインジケーターとトップノッチの機能を1つの取引戦略に組み合わせ、すべてのタイプのトレーダーにとって汎用性のある選択肢にします。 デイリートレーディングとスキャルピング戦略:高速で正確なデイトレーディングおよび短期トレード
Gold Stuff mt5
Vasiliy Strukov
4.89 (167)
Gold Stuff mt5 は、金専用に設計されたトレンド指標であり、あらゆる金融商品にも使用できます。 インジケーターは再描画せず、遅れません。 推奨時間枠 H1. 設定と個人的なボーナスを得るために、購入後すぐに私に連絡してください!   設定 矢印を描く - オンオフ。 チャートに矢印を描く。 アラート - 可聴アラートのオンオフ。 メール通知 - オンオフ。 電子メール通知。 プチ通知 - オンオフ。 プッシュ通知。 次に、色域を調整します。 Gold Stuff mt5 は、金専用に設計されたトレンド指標であり、あらゆる金融商品にも使用できます。 インジケーターは再描画せず、遅れません。 推奨時間枠 H1. 設定と個人的なボーナスを得るために、購入後すぐに私に連絡してください!   設定 矢印を描く - オンオフ。 チャートに矢印を描く。 アラート - 可聴アラートのオンオフ。 メール通知 - オンオフ。 電子メール通知。 プチ通知 - オンオフ。 プッシュ通知。 次に、色域を調整します。
ご紹介   クォンタム トレンド スナイパー インジケーターは 、トレンド反転を特定して取引する方法を変革する画期的な MQL5 インジケーターです。 13年以上の取引経験を持つ経験豊富なトレーダーのチームによって開発されました。     クォンタムトレンドスナイパーインジケーター   は、非常に高い精度でトレンドの反転を識別する革新的な方法で、あなたのトレーディングの旅を新たな高みに押し上げるように設計されています。 ***Quantum Trend Sniper Indicatorを購入すると、Quantum Breakout Indicatorを無料で入手できます!*** クォンタム ブレイクアウト インジケーターは、トレンドの反転を特定するとアラートを発し、矢印を示し、3 つのテイクプロフィットレベルを提案します。 初心者トレーダーにもプロのトレーダーにも適しています。 量子EAチャネル:       ここをクリック MT4のバージョン:       ここをクリック 推奨事項: 期間:すべての時間枠。最良の結果を得るには、M
FX Volume MT5
Daniel Stein
4.94 (17)
mql5と Telegramの モーニング・ブリーフィングで、詳細とスクリーンショットを含む毎日のマーケット・アップデートをご覧 ください! FX Volumeは、ブローカーの視点から市場のセンチメントをリアルに洞察する、最初で唯一の出来高インジケーターです。 ブローカーのような機関投資家が外国為替市場でどのようなポジションをとっているか、COTレポートよりもはるかに速く、素晴らしい洞察を提供します。 この情報をチャート上で直接見ることは、あなたの取引にとって真のゲームチェンジャーであり、画期的なソリューションです。 以下のようなユニークなマーケットデータ洞察から利益を得てください。 比率は 、通貨のロングポジションとショートポジションの比率をパーセントで表示します。 比率の変化は 、選択した期間内のロング比率とその変化率を表示します。 Volumes Totalは 、通貨の取引量(ロングとショート)の合計をロット単位で表示します。 Volumes Long :全通貨のロングポジションの取引量を表示します。 Volumes(ショート )は、全通貨のショートポジションの取引量を表示
まず第一に、この取引ツールはノンリペイント、ノンリドロー、ノンラグの指標であり、プロの取引に理想的ですことを強調する価値があります。 スマートプライスアクションコンセプトインジケーターは、新米から経験豊富なトレーダーまで、非常 に強力なツールです。Inner Circle Trader AnalysisやSmart Money Concepts Trading Strategiesなど、20以上の有用な指標を1つに組み合わせています。このインジケーターはスマートマネーコンセプトに焦点を当て、大手機関の取引方法を提供し、彼らの動きを予測するのに役立ちます。 特に、流動性分析に優れており、機関がどのように取引しているかを理解しやすくしています。市場のトレンドを予測し、価格の動きを慎重に分析するのに優れています。機関の戦略とトレードを合わせることで、市場の動向についてより正確な予測ができます。このインジケーターは多目的であり、市場構造を分析し、重要な注文ブロックを特定し、さまざまなパターンを認識するのに優れています。 このインジケーターはBOSやCHoCHなどのパターンの識
現在33%オフ 初心者にもエキスパートトレーダーにも最適なソリューション このインジケーターは独自の機能と新しい公式を多数内蔵しており、ユニークで高品質かつ手頃な取引ツールです。このアップデートでは、2つの時間枠ゾーンを表示できるようになります。より長いTFだけでなく、チャートTFとより長いTF(ネストゾーンを表示)の両方を表示できます。すべてのSupply Demandトレーダーの皆さんのお気に召すはずです。:) 重要情報の公開 Advanced Supply Demandの可能性を最大化するには、 https://www.mql5.com/ja/blogs/post/720245 にアクセスしてください。   エントリーまたはターゲットの正確なトリガーポイントを正確に特定できれば取引がどのように改善されるか想像してみてください。新しい基盤となるアルゴリズムに基づいて構築されているため、買い手と売り手の間の潜在的な不均衡をさらに簡単に特定できます。これは、最も強い需要と供給のゾーンと、過去のパフォーマンス(古いゾーンを表示)がグラフィカルに表現されるためです。これらの機能は、最適
A key element in trading is zones or levels from which decisions to buy or sell a trading instrument are made. Despite attempts by major players to conceal their presence in the market, they inevitably leave traces. Our task was to learn how to identify these traces and interpret them correctly. Reversal First Impulse levels (RFI)   -  Version MT4                  INSTRUCTIONS                 RUS                 ENG                         R ecommended to use with an indicator   -  TREND PRO  
AW Trend Predictor MT5
AW Trading Software Limited
4.76 (55)
1 つのシステムでのトレンド レベルとブレイクダウン レベルの組み合わせ。高度なインジケーター アルゴリズムは、市場のノイズをフィルター処理し、トレンド、エントリー ポイント、および可能なエグジット レベルを決定します。インジケーターシグナルは統計モジュールに記録されるため、最適なツールを選択してシグナル履歴の有効性を示すことができます。この指標は、テイクプロフィットとストップロスのマークを計算します。 マニュアルと説明書 ->   ここ / MT4 バージョン ->   ここ インジケーターで取引する方法: Trend Predictor での取引は、たった 3 つの簡単なステップです。 ステップ 1 - ポジションを開く 70% 以上の成功率で買いシグナルが受信されました ステップ 2 - ストップロスの決定 逆信号でトランクを選択 ステップ 3 - テイクプロフィット戦略の定義 戦略 1: TP1 に到達したらポジション全体をクローズする 戦略 2: TP1 に達した時点でポジションの 50% をクローズし、TP2 に達した時点で残りの 50% をクローズします。 戦略 3:
TPSpro TRENDPRO  - is a trend indicator that automatically analyzes the market and provides information about the trend and each of its changes, as well as giving signals for entering trades without redrawing! The indicator uses each candle, analyzing them separately. referring to different impulses - up or down impulse. Exact entry points into transactions for currencies, crypto, metals, stocks, indices!  -  Version MT4                  DETAILED DESCRIPTION        /       TRADING SETUPS       
mql5と Telegramの モーニング・ブリーフィングで、詳細とスクリーンショットを含む毎日のマーケット・アップデートをご覧 ください! FX Power MT5 NGは 、長年の人気を誇る通貨強度計FX Powerの次世代モデルです。 この次世代ストレングスメーターは何を提供するのでしょうか?初代FXパワーの魅力すべて プラス GOLD/XAUの強さ分析 より正確な計算結果 個別に設定可能な分析期間 カスタマイズ可能な計算上限値により、さらに優れたパフォーマンスを実現 もっと見たい人のための特別なマルチインスタンス設定 すべてのチャートでお好みの色を無限に設定可能 数え切れないほどの通知オプションにより、重要なことを見逃すことはありません。 Windows 11とmacOSのスタイルで角を丸くした新しいデザイン 魔法のように動くインジケーターパネル FXパワーの主な機能 すべての主要通貨の強さの完全な履歴 すべての時間枠における通貨の強さの履歴 すべてのブローカーとチャートで同一の計算結果 100%信頼できるリアルタイム計算 -> リペイントなし ドロップダウン・リストから
これはMT5のインジケーターで、再描画なしで取引に参入するための正確なシグナルを提供します。 外国為替、暗号通貨、金属、株式、インデックスなど、あらゆる金融資産に適用できます。かなり正確な見積もりを提供し、取引を開始して終了するのに最適な時期を教えてくれます。1つのシグナルを処理しただけでインジケーターの元が取れた例の 動画 (6:22)をご覧ください。Entry PointsPro インジケーターの助けを借りたほとんどのトレーダーの最初の1週間の結果が改善しています。 Telegramグループ に登録してください。Entry Points Proインジケーターのメリットは次の通りです。 再描画のないエントリーシグナル 再描画されるインジケーターでは一度表示されたシグナルが削除されて大きな金銭的損失につながることがありますが、これと異なり、表示されて確認されたシグナルは消えることがありません。 エラーなしの取引開始 インジケーターアルゴリズムによって取引を開始する(資産を売買する)理想的な瞬間を見つけることができます。それを使用するすべてのトレーダーの成功率が向上します。
今、147ドル(いくつかの更新後に499ドルに増加します) - 無制限のアカウント(PCSまたはMac) RelicusRoad ユーザー マニュアル + トレーニング ビデオ + プライベート Discord グループへのアクセス + VIP ステータス 市場の新しい見方 RelicusRoad は、外国為替、先物、暗号通貨、株式、および指数の世界で最も強力な取引インジケーターであり、トレーダーに収益を維持するために必要なすべての情報とツールを提供します。初心者から上級者まで、すべてのトレーダーが成功するためのテクニカル分析と取引計画を提供します。これは、将来の市場を予測するのに十分な情報を提供する重要な取引指標です。意味をなさないチャート上のいくつかの異なる指標ではなく、完全な解決策を信じています.これは、信号、矢印 + 価格アクション情報を表示するオールインワンのインジケーターで、他に類を見ない非常に正確です。 強力な AI に基づいて、RelicusRoad は不足している情報とツールを提供して、あなたを教育し、トレーディングのプロ、成功したトレーダーにします。
Gartley Hunter Multi - An indicator for searching for harmonic patterns simultaneously on dozens of trading instruments and on all classic timeframes: (m1, m5, m15, m30, H1, H4, D1, Wk, Mn). Manual (Be sure to read before purchasing) | Version for MT4 Advantages 1. Patterns: Gartley, Butterfly, Shark, Crab. Bat, Alternate Bat, Deep Crab, Cypher 2. Simultaneous search for patterns on dozens of trading instruments and on all classic timeframes 3. Search for patterns of all possible sizes. Fr
Noize Absorption Index - is the manual trading system that measures the difference of pressure between bears forces and bulls forces. Green line - is a noize free index that showing curent situation. Zero value of index shows totally choppy/flat market.Values above zero level shows how powerfull bullish wave is and values below zero measures bearish forces.Up arrow appears on bearish market when it's ready to reverse, dn arrow appears on weak bullish market, as a result of reverse expectation.
ICT, SMC, SMART MONEY CONCEPTS, SMART MONEY, Smart Money Concept, Support and Resistance, Trend Analysis, Price Action, Market Structure, Order Blocks, BOS/CHoCH,   Breaker Blocks ,  Momentum Shift,   Supply&Demand Zone/Order Blocks , Strong Imbalance,   HH/LL/HL/LH,    Fair Value Gap, FVG,  Premium  &   Discount   Zones, Fibonacci Retracement, OTE, Buy Side Liquidity, Sell Side Liquidity, BSL/SSL Taken, Equal Highs & Lows, MTF Dashboard, Multiple Time Frame, BigBar, HTF OB, HTF Market Structure
Professional Scalping Tool on Deriv Attention! The indicator will be sold in limited quantities!!! The previous 5 copies were sold for $250 The next 5 copies will be sold for $350 The next price is $500 Description: This trading indicator is designed for professional traders focused on scalping. Designed with the market in mind, it provides highly accurate spike trading signals. It works on the M1 timeframe and supports the following symbols: Boom 300 Index, Boom 500 Index, Boom 1000 Index,
The Volume by Price Indicator for MetaTrader 5 features Volume Profile and Market Profile TPO (Time Price Opportunity). Get valuable insights out of currencies, equities and commodities data. Gain an edge trading financial markets. Volume and TPO histogram bar and line charts. Volume Footprint charts. TPO letter and block marker charts including split structures. Versatile segmentation and compositing methods. Static, dynamic and flexible ranges with relative and/or absolute visualizations. Lay
MetaForecast M5
Vahidreza Heidar Gholami
5 (2)
MetaForecastは、価格データのハーモニクスに基づいて、どんな市場の未来を予測し視覚化します。市場が常に予測可能ではありませんが、価格にパターンがある場合、MetaForecastは可能な限り正確な未来を予測できます。他の類似製品と比較して、MetaForecastは市場のトレンドを分析することでより正確な結果を生成することができます。 入力パラメータ Past size (過去のサイズ) MetaForecastが将来の予測を生成するために使用するバーの数を指定します。モデルは選択したバー上に描かれた黄色の線で表されます。 Future size (将来のサイズ) 予測すべき将来のバーの数を指定します。予測された将来は、ピンクの線で表示され、その上に青い回帰線が描かれます。 Degree (程度) この入力は、MetaForecastが市場で行う分析のレベルを決定します。 Degree 説明  0 Degree 0の場合、価格の全てのピークや谷、そして詳細をカバーするために、「Past size」の入力に大きな値を使用することが推奨されています。  1 (推奨) Degr
Auto Order Block with break of structure based on ICT and Smart Money Concepts Futures Break of Structure ( BoS )             Order block ( OB )            Higher time frame Order block / Point of Interest ( POI )    shown on current chart           Fair value Gap ( FVG ) / Imbalance   ,  MTF      ( Multi Time Frame )    Volume Imbalance     ,  MTF          vIMB Gap’s Equal High / Low’s     ,  MTF             EQH / EQL Liquidity               Current Day High / Low           HOD /
Quantum平均足PRO のご紹介 市場のトレンドに対する明確な洞察を提供するように設計された平均足キャンドルは、ノイズを除去し、誤ったシグナルを排除する能力で知られています。混乱を招く価格変動に別れを告げ、よりスムーズで信頼性の高いチャート表現を導入しましょう。 Quantum Heiken Ashi PRO を真にユニークなものにしているのは、従来のローソク足データを読みやすい色のバーに変換する革新的なフォーミュラです。赤と緑のバーはそれぞれ弱気トレンドと強気トレンドをエレガントに強調し、潜在的なエントリーポイントとエグジットポイントを驚くほど正確に見つけることができます。 量子EAチャネル:       ここをクリック MT4のバージョン:       ここをクリック この注目すべき指標には、いくつかの重要な利点があります。 明確性の向上: 価格変動を平滑化することで、平均足バーは市場トレンドをより明確に表現し、有利な取引機会を特定しやすくします。 ノイズの削減: 誤ったシグナルを引き起こすことが多い不安定な価格変動に別れを告げます。 Quantum Heik
Was: $299  Now: $99   Supply Demand uses previous price action to identify potential imbalances between buyers and sellers. The key is to identify the better odds zones, not just the untouched ones. Blahtech Supply Demand indicator delivers functionality previously unavailable on any trading platform. This 4-in-1 indicator not only highlights the higher probability zones using a multi-criteria strength engine, but also combines it with multi-timeframe trend analysis, previously confirmed swings
ご紹介     Quantum Breakout PRO は 、ブレイクアウト ゾーンの取引方法を変革する画期的な MQL5 インジケーターです。 13年以上の取引経験を持つ経験豊富なトレーダーのチームによって開発されました。     クォンタム ブレイクアウト プロ   は、革新的でダイナミックなブレイクアウト ゾーン戦略により、あなたのトレーディングの旅を新たな高みに押し上げるように設計されています。 クォンタム ブレイクアウト インジケーターは、5 つの利益ターゲット ゾーンを備えたブレイクアウト ゾーン上のシグナル矢印と、ブレイクアウト ボックスに基づいたストップロスの提案を提供します。 初心者トレーダーにもプロのトレーダーにも適しています。 量子EAチャネル:       ここをクリック 重要!購入後、インストールマニュアルを受け取るためにプライベートメッセージを送ってください。 推奨事項: 時間枠: M15 通貨ペア: GBPJPY、EURJPY、USDJPY、NZDUSD、XAUUSD アカウントの種類: ECN、Raw、またはス
Step into the realm of Forex trading with confidence and precision using XQ, a cutting-edge Forex indicator designed to elevate your trading game to unprecedented heights. Whether you're a seasoned trader or just stepping into the world of currency exchange, XQ Forex Indicator empowers you with the insights and signals needed to make informed trading decisions. The signal conditions are a combination of three indicators, and XQ Forex Indicator only display  medium and long-term trends . The ind
MT4版  |  FAQ Owl Smart Levels Indicator は、 Bill Williams の高度なフラクタル、市場の正しい波構造を構築する Valable ZigZag、エントリの正確なレベルをマークする Fibonacci レベルなどの一般的な市場分析ツールを含む 1 つのインジケーター内の完全な取引システムです。 利益を得るために市場と場所に。 戦略の詳細な説明 インジケータを操作するための指示 顧問-取引助手 プライベートユーザーチャット ->購入後に私に書いて、私はプライベートチャットにあなたを追加し、あなたはそこにすべてのボーナスをダウンロードすることができます 力はシンプルさにあります! Owl Smart Levels 取引システムは非常に使いやすいので、専門家にも、市場を勉強し始めて自分で取引戦略を選択し始めたばかりの人にも適しています。 戦略と指標に秘密の数式や計算方法が隠されているわけではなく、すべての戦略指標は公開されています。 Owl Smart Levels を使用すると、取引を開始するためのシグナルをすばやく確認し、注文を出すため
ENG-GOLD Scalper It is an auxiliary indicator that identifies potential targets and determines the place of entry with a stop loss that works on Heiken Ashi candles  The green lines are usually the targets, the red lines are the stop loss, and the yellow lines are the entry location.  This file is recognized on small and medium frames, usually less than the watch frame I highly recommend using XAUUSD US100 US30 USOIL 
まず最初に、このトレーディングシステムがリペイントされず、再描画されず、遅延しないことを強調する価値があります。これにより、プロのトレーディングに最適な状態になります。 「スマートサポートアンドレジスタンストレーディングシステム」は、新規および経験豊富なトレーダー向けにカスタマイズされた高度なインジケーターです。この包括的なシステムは、7以上の戦略、10のインジケーター、およびデイトレード戦略、スイングトレード戦略、サポートおよびレジスタンス戦略、ローソク足パターン戦略、VWAP戦略、マルチタイムフレームトレンド戦略など、さまざまなトレーディングアプローチを組み合わせています。これは、矢印信号、エントリーポイント、出口ポイント、トレードアラート、より高い時間枠のトレンド分析、リアルタイムのトレードモニタリング、そして洞察力のあるトレンドとボリュームキャンドルの着色を提供します。自動的なサポートとレジスタンスの検出により、さまざまな市況下でトレーダーが的確な決定を下すのを支援する多面的なインジケーターとなっています。 スマートサポートアンドレジスタンストレーディングシステムは、
This indicator can be used to display Support and Resistance levels according to  the  Malaysian SNR concept , in which Support and Resistance are exact levels of a line chart. Malaysian SNR There are 3 different horizontal levels in Malaysian SNR: A-Level : This level is located at the peak of this line chart. (shape looks like the letter A) V-Level : Level at the valley of a line chart, (shape looks like the letter V) Gap-Leve l: This level is located at the Close/Open gap between two cand
Was: $249  Now: $99   Market Profile defines a number of day types that can help the trader to determine market behaviour. A key feature is the Value Area, representing the range of price action where 70% of trading took place. Understanding the Value Area can give traders valuable insight into market direction and establish the higher odds trade. It is an excellent addition to any system you may be using. Inspired by Jim Dalton’s book “Mind Over Markets”, this indicator is designed to suit the
Gartley Hunter - An indicator for searching for harmonic patterns (Gartley patterns) and their projections. The indicator is equipped with a system of alerts and push notifications. Manual (Be sure to read before purchasing) | Version for MT4 Advantages 1. 12 harmonic patterns: 7 classical and 5 exotic. New patterns will be added as the indicator develops. 2. Constant automatic search for harmonic patterns. The indicator is capable of finding from the smallest to the largest patterns. 3. Autom
作者のその他のプロダクト
Standard PVSR is based on Pivot Points. Steps to Setup the Indicator: Install the Custom Indicator; Set all the Lines Color, Width and Styles; Set visualization to All Timeframe; and DONE It can be used for: All Pairs: Forex, Cryptocurrencies, Metals, Stocks, Indices etc. All Timeframe All Brokers All type of Trading Style like Scalping, Swing, Intraday, Short-Term, Long-Term etc. Multiple Chart -->> For any Type of Support, Guidance, Setup Issue, EA Optimization, Input Setup etc.
FREE
MACros is based on Exponential Moving Average Crossover: It can be used for: All Pairs: Forex, Cryptocurrencies, Metals, Stocks, Indices.  All Timeframe All Brokers All type of Trading Style like Scalping, Swing, Intraday, Short-Term, Long-Term etc. Multiple Chart ***MT5 Version -->>  https://www.mql5.com/en/market/product/87474 Notification Setting: All type of notifications and Pop-Up available with this Indicator. (Can manually ON/OFF the notification as per requirements.) Special No
MAC_iCHIMOKU is an Indicator best for Scalping and Swing Both. It can be used for: All Pairs:  Forex, Cryptocurrencies, Metals, Stocks, Indices.  All Timeframe All Brokers All type of Trading Style like Scalping, Swing, Intraday, Short-Term, Long-Term etc. Multiple Chart This Indicator is based on  Upcoming Trend Probability  made with an unique Combination of Moving average, Ichimoku Cloud, Price Action and Support Resistance zones. If you are a Scalper or Swing Trader, then this Indicator will
MACros
Ashok Kumar Singha
MACros is based on Exponential Moving Average Crossover: It can be used for: All Pairs: Forex, Cryptocurrencies, Metals, Stocks, Indices.  All Timeframe All Brokers All type of Trading Style like Scalping, Swing, Intraday, Short-Term, Long-Term etc. Multiple Chart *** MT4 Version-->> https://www.mql5.com/en/market/product/87538 Notification Setting: All type of notifications and Pop-Up available with this Indicator. (Can manually ON/OFF the notification as per requirements.) Special Not
Maichi Pro
Ashok Kumar Singha
MAICHI PRO : This EA is a Fully Automated Robot which take the Trades very efficiently.  This is based on Swing and Scalping Techniques; Can be used in Multiple Charts with Different Time Frames at the same time; Can be used in Forex, Metal, Energy, Stocks and Crypto as well;  Strategy : This EA is made based on the Strategy of Price Momentum, Trend, Price Action and Support Resistance. In this EA we can set TP, SL and TSL as per our needs and Optimization Setup. We can use this EA for Hedging
Ichimoku Genius (imG)  is a very Intelligent Indicator for the Perfect Entry & Exit. This is strongly recommended to: Check the Video properly to understand the Indicator setup, how does it work and exactly how to take Entries and Exit according to this Indicator. Please use this Indicator with "Pivot Points" & "Kijun-Sen" to get the Best result. Always give preference to Long Flat area of "KIJUN SEN" Line as this is act like a strong Support -or- Resistance. Steps to Setup the Indicator: I
My Pivot is an Indicator based on Pivot Lines and Support-Resistance zones. This Indicator will Plot 11 SR zones including Pivot Line which will definitely help you to understand the exact SR zones of the Market. Steps to Setup the Indicator: Install the Custom Indicator; Set all the Lines Color, Width and Styles; Set visualization to All Timeframe; and DONE It can be used for: All Pairs: Forex, Cryptocurrencies, Metals, Stocks, Indices.  All Timeframe All Brokers All type of Trading
My Trendline is an Indicator based on Upper and Lower Trendline which will Plot Automatically into the Chart. This Indicator will perfectly indicate you the Trend of the Market. It can be use in any Time Frame. The Indicator will automatically adjust according to the Current Time Frame. Steps to Setup the Indicator: Install the Custom Indicator; Set all the Inputs, Line Color, Width and Styles etc. (Can use the Default Setting also); Set visualization to All Timeframe; and DONE It ca
My Pivot Pro is the Pro Version of the Indicator " My PIVOT " ( Link:  https://www.mql5.com/en/market/product/90336 ) This indicator will help you a lot to decide the Market Range and Movement.  This Indicator is based on Pivot Lines and Support-Resistance zones. Now we can Plot Standard/Classic; Fibonacci; Demark; Camarilla nd Woodies Pivot Levels as per our requirements. Steps to Setup the Indicator: Install the Custom Indicator; Set the Pivot Type; Period and Time ( We recommend to use
Dr. Trend   is based on Market Trend Detection. With this Indicator anybody can easily understand the Market Trend and Trade accordingly. It will be very very helpful to Trade perfectly and increase the Accuracy Level.  Recommendation: Use this Indicator along with my another Indicator --->>> Dr. Trend Alert ; Use this Indicator along with my another Indicator --->>>   My PVSR   <<<--- Click Here ; Good_Luck It can be used for: All Pairs: Forex, Cryptocurrencies, Metals, Stocks, Indice
My PVSR
Ashok Kumar Singha
My PVSR   is based on All Type of Pivot Points. Use this Indicator to get proper Support / Resistance Zone and Trade accordingly.. Recommendation: Use this Indicator along with my another Indicator --->>> Dr. Trend   <<<--- Click Here ; To get the best output result feel free to contact me ; Best of Luck It can be used for: All Pairs: Forex, Cryptocurrencies, Metals, Stocks, Indices etc. All Timeframe All Brokers All type of Trading Style like Scalping, Swing, Intraday, Short-Term, Lon
フィルタ:
レビューなし
レビューに返信