Tw79 Correlation matrix
- インディケータ
- Tufan Gocmen
- バージョン: 1.0
- アクティベーション: 12
Hello;
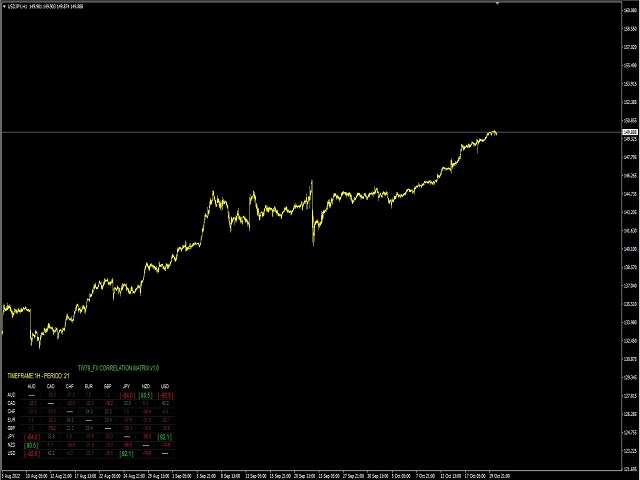
This indicator presents you with a power matrix of 28 cross pairs made up of the eight most voluminous currencies. Thanks to this power chart, it shows the pairs with the best trend strength and direction. The dashboard offers a basket trading method. So you can make an average profit by trading between pairs with certain correlations.
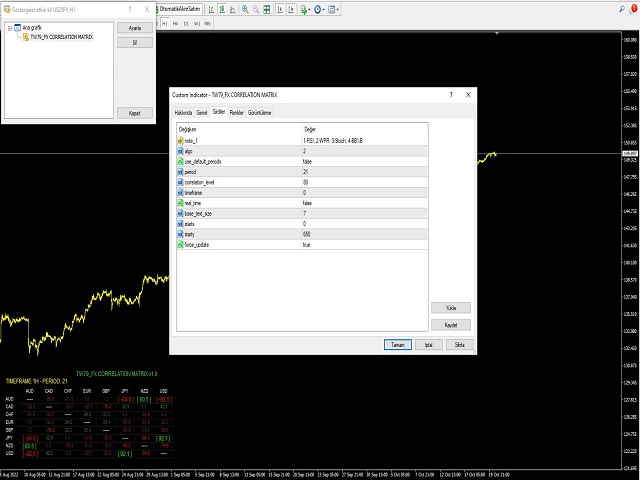
Input parameter descriptions:
Note_1: Indicates which method the dashboard will use to find the correlation.
Input parameter that allows you to select Algo:Note_1 methods.
Use_default_period: If false, it calculates all periods. If true, it calculates the graphic period.
Period: Indicates the number of bars to be calculated.
Correlation_level: Used to define the power level. Recommended level is the default setting.
Timeframe: Indicates the single period time to be calculated.
Real Time: Used for real-time rapid measurement calculation.