BarEndTime by MMD MT5
- インディケータ
- Mariusz Maciej Drozdowski
- バージョン: 1.0
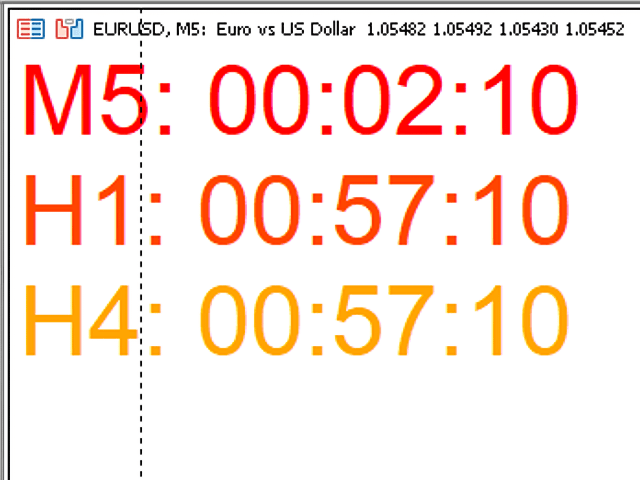
The Time End bar by MMD is a simple indicator that shows the number of seconds remaining in the three selected intervals.
According to the MMD methodology, the moment when a directional price movement occurs is important. This indicator allows you to use this relationship more effectively in Forex and Futures trading.
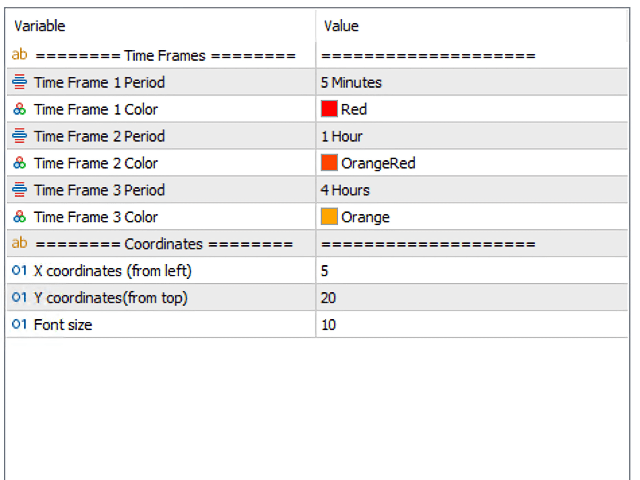
Functionality description:
Time Frame 1 Period - defining the first time interval
Time Frame 1 Color - specifying the color for the first time interval
Time Frame 1 Period - defines the second time interval
Time Frame 1 Color - specifying the color for the second time interval
Time Frame 1 Period - defines the third time interval
Time Frame 1 Color - specifying the color for the third time interval
Location of displayed data on the chart:
X coordinates - the number of points from the left side of the graph
Y coordinates - the number of points from the top of the graph
Font size - font size