Sessions Killzone
- インディケータ
- Wafa Mohammed Omar Abou Alwafa
- バージョン: 1.14
- アップデート済み: 16 5月 2023
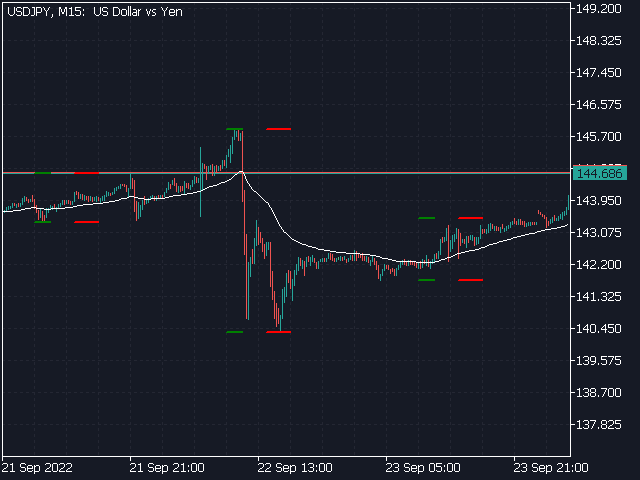
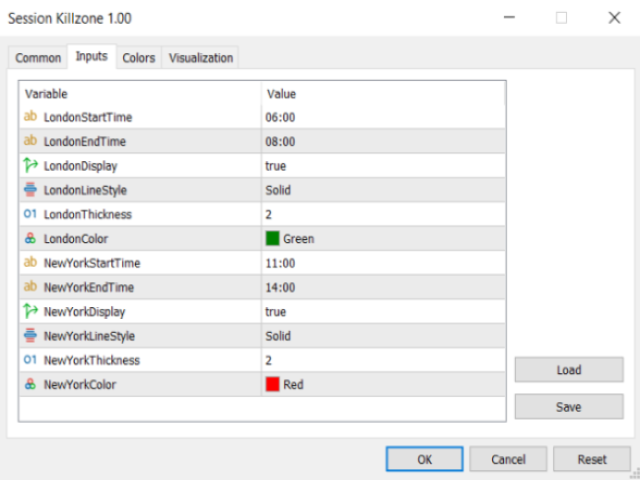
Session Killzone Indicator
Indicator that helps you to identify the killzone times of both London and NewYork sessions which usually is the most times for high volatility and taking liquidity from the market.
Killzone times are configurable through indicator parameters.
The indicator adjusts the range of the killzones based on the daily trading range.