Trend gain oscillator
- インディケータ
- Ekaterina Saltykova
- バージョン: 1.20
- アップデート済み: 22 9月 2022
- アクティベーション: 5
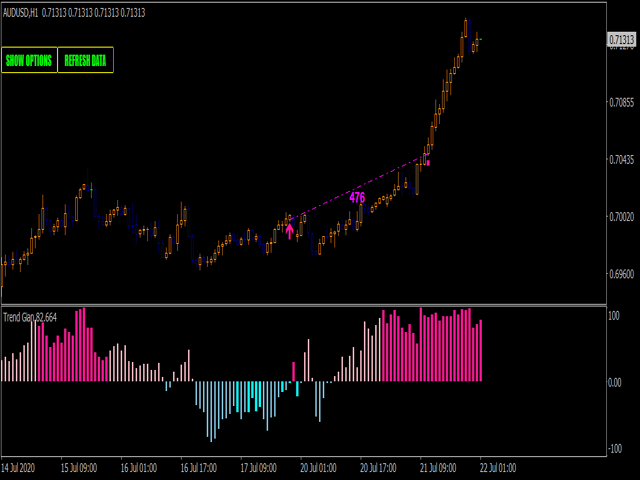
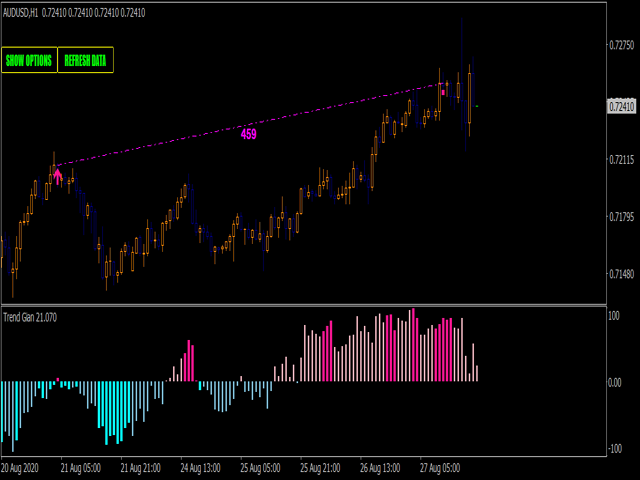
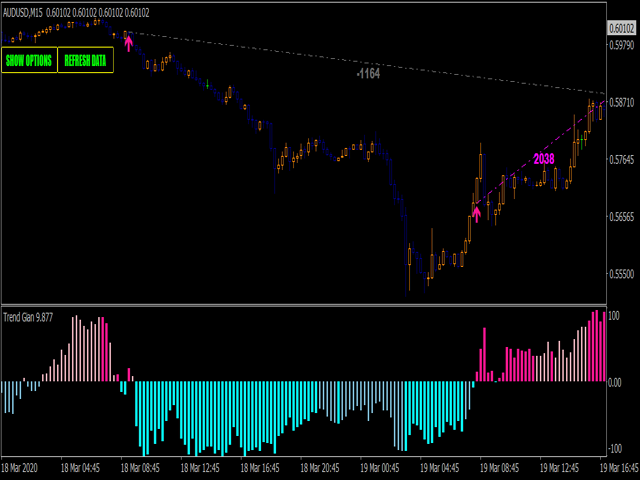
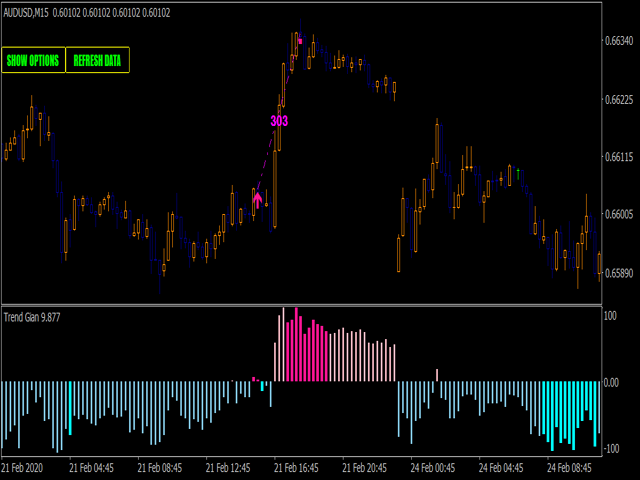
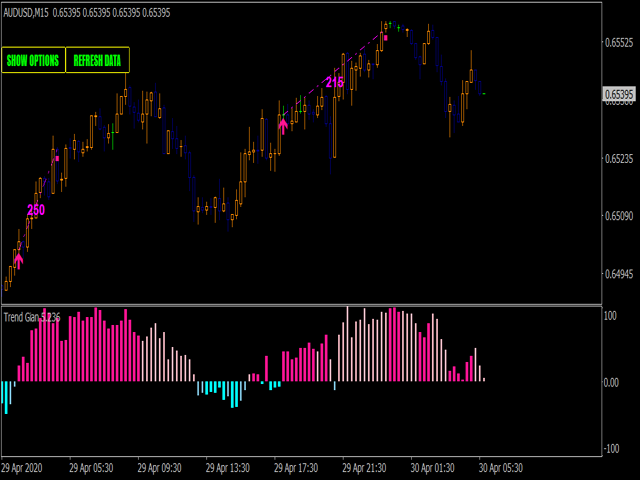
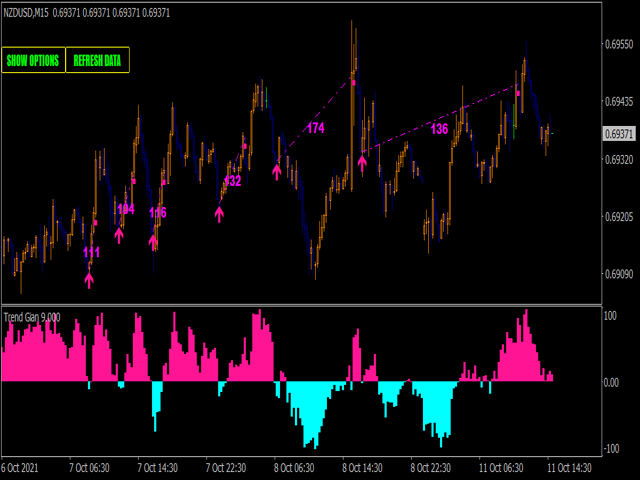
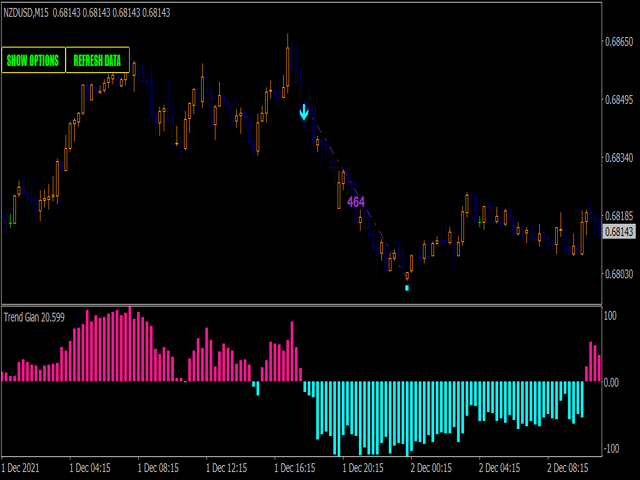
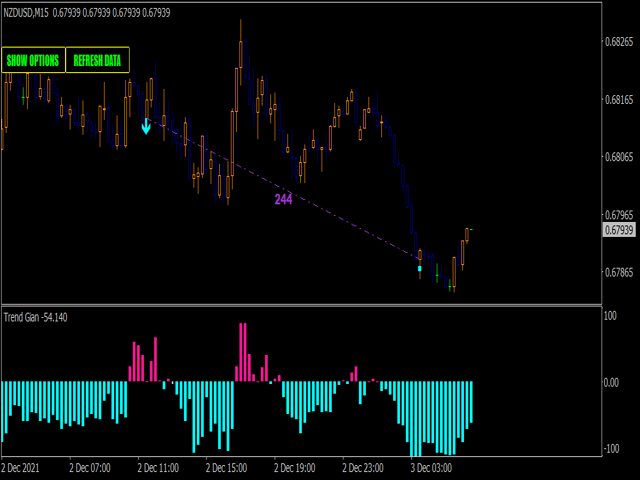
Trend Gain Oscillator - is the manual system for defining trend phase(bullish/bearish). When histogramm is pink - market is up/bullish and when histogramm is blue - market is down/bearish. Arrows is plotted on zero cross, in case if additionally market has power for future movement.
Main inputs are :
- trendPeriod- main indicator's period for trend calculation;
- trendPowerPeriod - period for market's power(volatility+volume) calculation;
- trendPowerTrigger - arrows is not plotted if market's power less than this value;
- trendReversePoint - indicator's trend reversal point ;
Main Indicator's Features
- Signals are not repaint,non-late or disappear(exept cases when system recalculates all history datas,refreshing main settings or Metatrader refreshes new incomming datas);
- Every signal comes at the open of new bar(system uses only confirmed signals);
- Indicator has Alerts, Mail and Push notifications(allow to trade out of PC, from smartphone/mobile app);
- Possible to disable arrow strategy and use only histogram.
Recommendations for trading
- Scalping timeframes: M5-H1 range;
- Volatility pairs like EURUSD, GBPUSD, USDCAD, GOLD, GBPJPY, Crypto;