Double Inside Bars
- インディケータ
- Juan Facundo Valdes
- バージョン: 1.0
この指標は、YouTube チャンネル「The Secret Mindset」のビデオ「A Reliable Scalping Strategy I Discovered After 1 Month of Price Action Trading」で提案された戦略に基づいています。 インジケーター
信号
推奨レベル
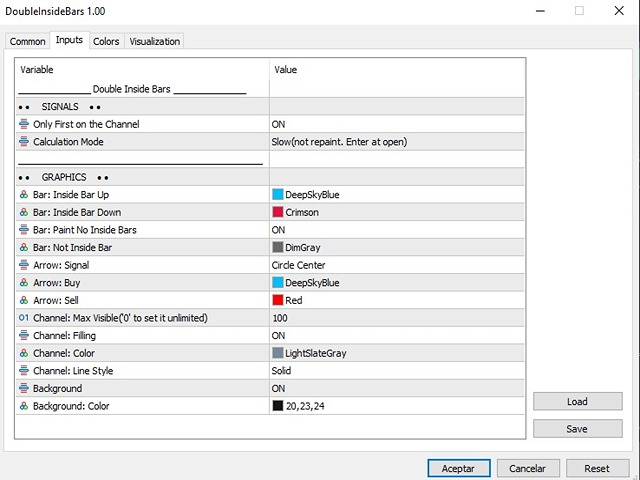
バー、信号、チャンネルの色、矢印の形状も簡単に調整できます。 バーの色を無効にするには、バーの色を「なし」に設定します。
信号をフィルタリングするための戦略と条件の完全かつ詳細な説明は、ビデオで公開されています。
* YouTube チャンネルの作成者はこのインジケーターの開発とは関係ありません
シグナルは他のインジケーターと組み合わせて、各トレーダーの判断によってフィルタリングする必要があります
インジケーター
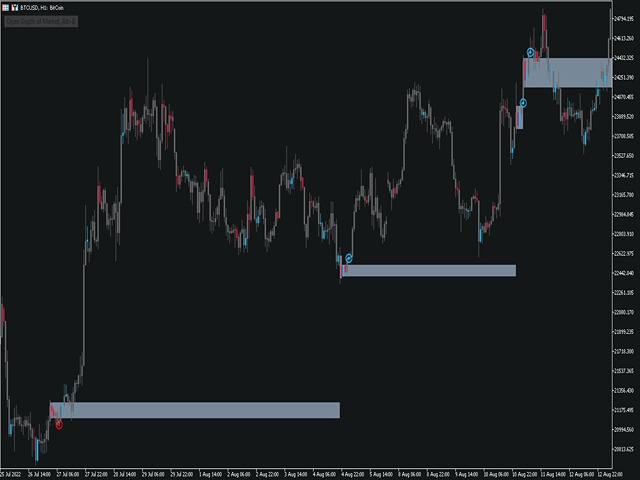
- 前のバーの高値/安値範囲内にあるバーは、インサイドバーと呼ばれます。 インジケーターはオプションでこれらのバーをペイントできます
- 2 つの連続するインサイドバーはチャネルを作成し、多くの場合サポートレベルまたはレジスタンスレベルとしても機能します
信号
インジケーターは、2 つの異なるモードで信号矢印を表示できます。
- FAST: バーが閉じるまでシグナルが再描画されるため、トレーダーはシグナル バーがすでに閉じた後、次のバーが開いているときにのみエントリーする必要があります。 これにより、信号を確認する前に次の信号を予測することができます。 • SLOW: 信号 は再描画されません。 矢印は、シグナルバーがすでに閉じられ、チャンネルブレイクを確認した後にのみ表示されます
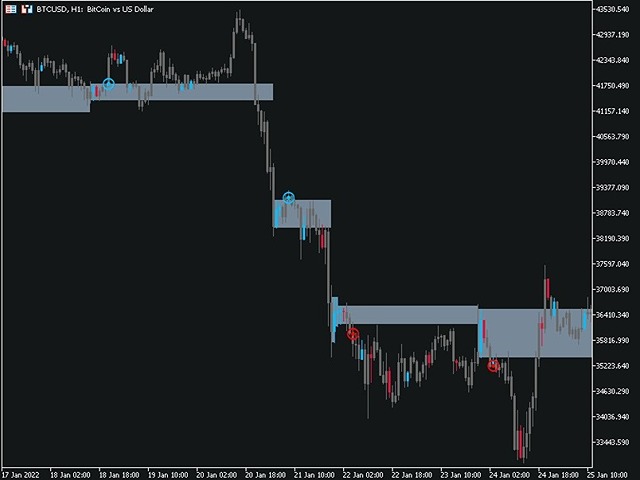
条件:
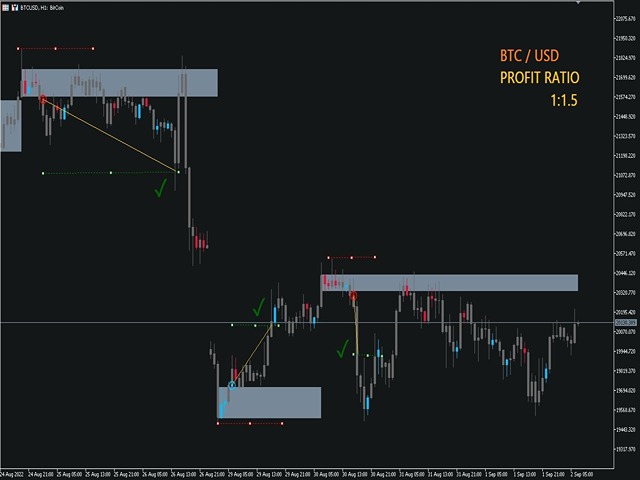
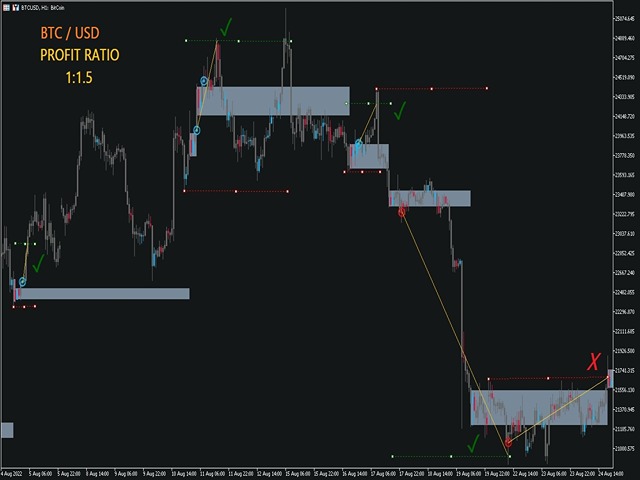
- 購入: 価格がチャネルの上限を上方に突破したとき
- 販売: 価格がチャネルの下位レベルを下方に突破したとき
オプションで、インジケーターにはチャンネルのすべての信号、または最初に表示される信号のみが表示されます。
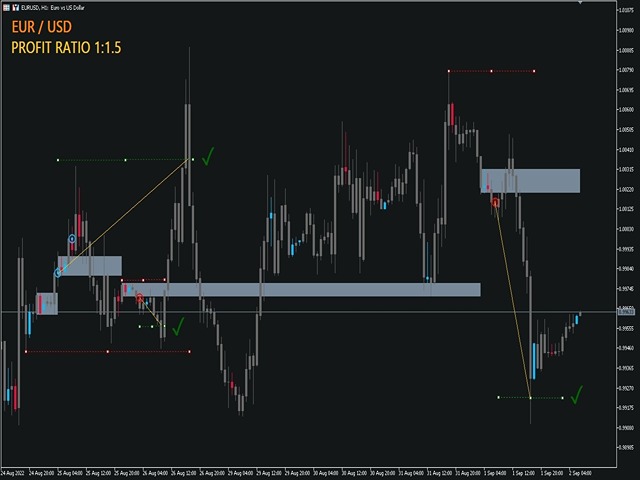
推奨レベル
- ストップロス: 購入時の最後の安値/売り時の最後の高値
- 利益の獲得: 1:1 ~ 1:2 比率
グラフィック設定
バー、信号、チャンネルの色、矢印の形状も簡単に調整できます。 バーの色を無効にするには、バーの色を「なし」に設定します。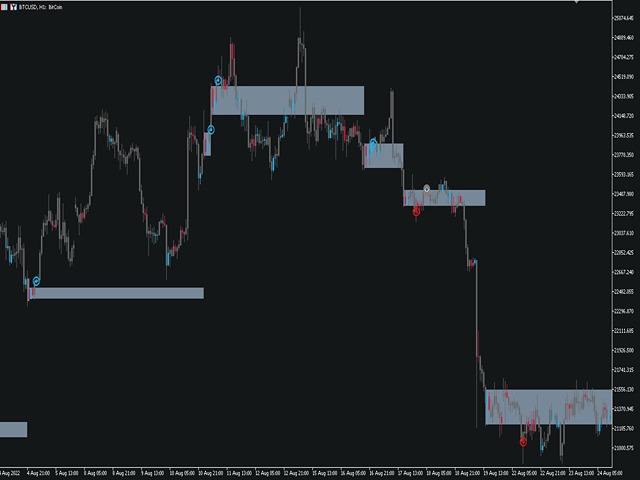


Very good indicator, lets you know where you stand in the market in relation to tops and bottoms.