Order Risk Management EA MT5
- ユーティリティ
- Young Ho Seo
- バージョン: 1.9
- アップデート済み: 5 12月 2021
Introduction to Order Risk Management EA
ORM EA is specially designed for fast and accurate market order execution to be used with our Price Action and Econometric Trading strategies listed below. ORM EA is fully automatic and ORM EA is also very easy to use. ORM EA is totally free of charge. You can also use this robust order execution feature of this ORM EA for any other your own trading strategy.
Trading Strategy Guide
Order Risk Management EA provides the guide for the risk management for your trading. It does not provide any entry or exit timing for your trading. Hence, to decide entry or exit for your trading, you can use any of following technical analysis.
Guide for Volume Spread Analysis: https://www.mql5.com/en/blogs/post/747652
Guide for Harmonic Pattern Detection Indicator: https://www.mql5.com/en/blogs/post/747647
Guide for Momentum Indicator: https://www.mql5.com/en/blogs/post/747633
Guide for Supply Demand Indicator: https://www.mql5.com/en/blogs/post/747632
Guide for Triangle Pattern, Falling Wedge Pattern, Rising Wedge Pattern and Channel: https://www.mql5.com/en/blogs/post/747649
Guide for Elliott Wave Indicator: https://www.mql5.com/en/blogs/post/747668
Guide for Volatility Indicator: https://www.mql5.com/en/blogs/post/747670
- Automatic Order Execution (both buy and sell) in one click.
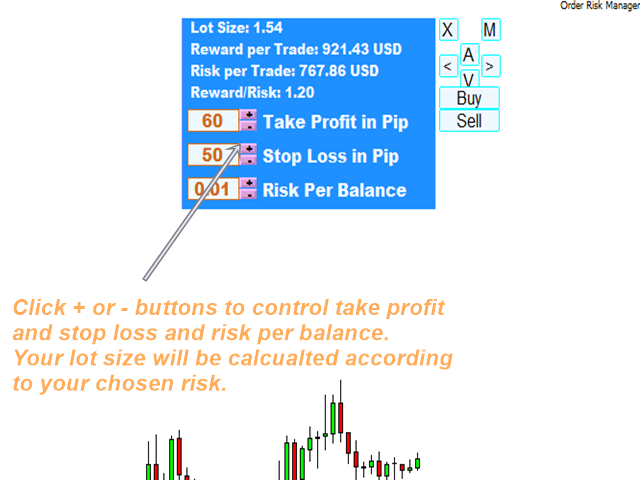
- Automatic Lot size Calculation for chosen risk Percent.
- Automatic Risk/Reward ratio calculation for your trading journal.
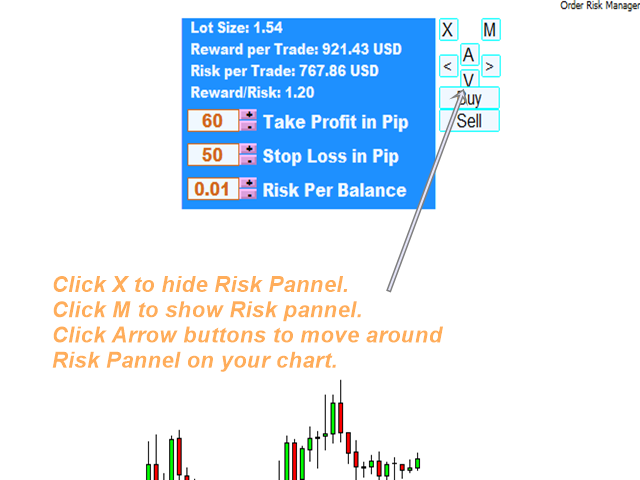
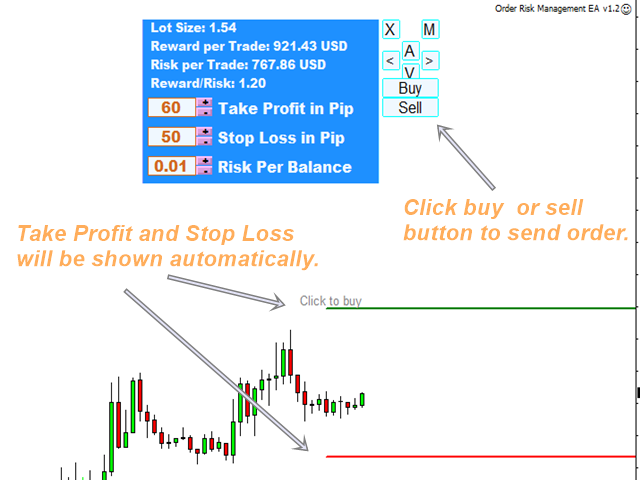
- Automatic Take Profit and Stop Loss display on your chart.
- You can choose between equity and balance to calculate your lot size.
- Very simple and easy to use but very handy to have it.
- Automatic Order Execution (both buy and sell) in one click.
- Automatic Lot size Calculation for chosen risk Percent.
- Automatic Risk/Reward ratio calculation for your trading journal.
- Automatic Take Profit and Stop Loss display on your chart.
- You can choose between equity and balance to calculate your lot size.
- Very simple and easy to use but very handy to have it.
- Key pressing A: open previous symbol chart in your market watch (above).
- Key pressing S: open next symbol chart in your market watch (below).
- Key pressing D: increase Take Profit.
- Key pressing C: decrease Take profit.
- Key pressing F: increase Stop Loss.
- Key pressing V: decrease Stop Loss.
- Key pressing J: On/off Auto Take Profit and Stop Loss display.
- Mouse over "Buy" button: shows Take profit and Stop loss for buy order.
- Mouse over "Sell" button: shows Take profit and Stop Loss for sell order.
- Mouse click on "Buy" button: send buy order with current take profit and stop loss.
- Mouse click on "Sell" button: send sell order with current take profit and stop loss.
- Key pressing D or C while mouse is over "Buy" or "Sell" button: you can increase or decrease take profit while you are dynamically seeing take profit line moving on your charts.
- Key pressing F or V while mouse is over "Buy" or "Sell" button: you can increase or decrease stop loss while you are dynamically seeing stop loss moving on your charts.
Further Note
ORM EA works with buttons and your key board buttons dynamically. Please take enough time to get comfortable with this EA before you start on your live trading. In addition, instead of using symbol button in Harmonic pattern Plus, Harmonic Pattern Scenario Planner, Price Breakout Pattern Scanner and Sideways Market Statistical Analyzer, use A or S key pressing for fast change of symbols.
Important Note
This is the off the shelf product. Therefore, we do not accept any modification or customization request on this product. In addition, we do not provide any code library or any support for your coding for this product.


Awesome I have been looking for this