Zigzag Pro MT5
- インディケータ
- Kaijun Wang
- バージョン: 1.20
- アップデート済み: 3 8月 2022
本指标 基于 Zigzag 基础上...
增加了:
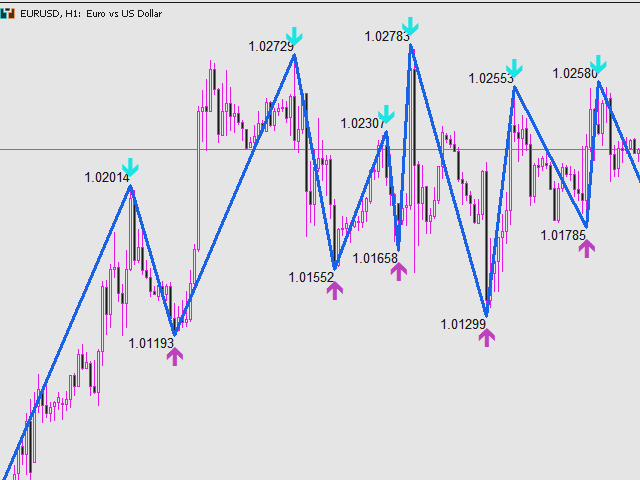
1.增加了箭头指示,使图表更鲜明
2.增加了价格显示,使大家更清楚的看清价格.
3.增加了报警等设置,可以支持邮件发送
原指标特性:
1.基本的波段指标构型.
2.最近的2个ZIGZAG点不具有稳定性,随着行情而改变,(就是网友所说的未来函数)
3.原指标适合分析历史拐点,波段特性,对于价格波动有一定的指导性.
Zigzag的使用方法一
丈量一段行情的起点和终点
(1)用ZigZag标注的折点作为起点和终点之后,行情的走势方向就被确立了(空头趋势);
(2)根据道氏理论的逻辑,行情会按照波峰浪谷的锯齿形运行,行情确立之后会走回撤行情,回撤的过程中ZigZag会再次形成折点,就是回撤点;
(3)在回撤点选择机会进场,等待行情再次启动,止损可以放到回撤的高点。
一套交易系统基本的框架就建立起来了。
Zigzag的使用方法二
作为画趋势线的连接点
趋势线是很常见的技术指标,在技术分析中被广泛地使用。但一直以来趋势线在实战中都存在一个BUG,那就是难以保证划线的一致性。
在图表上有很多的高低点,到底该连接哪一个呢?不同的书上画趋势线的方法也不同,有的要求不能有价格的穿越,有的要求却连接k线的实体。总体而言只有一个大致的原则,却没有统一的标准。
在图表上画趋势的时候,直接连接ZigZag指标的折点。图中左侧是破位的颈线,右侧是上升趋势线。
这样画趋势线,连接点由ZigZag指标自动生成,解决了实战中如何取点的问题,交易中更加客观,而且标准一致。
Zigzag的使用方法三
清晰地标注图标上的支撑和压力位置
支撑和压力位置是最基础,最重要,也是很有效的技术分析手段。
支撑压力位置行情有反转或者反弹的可能性,因此找到支撑和压力位置再结合一些技术指标和方法就可以组建成一套完整的交易系统。ZigZag指标可以自动在图表上标注支撑和压力位置。
注意事项:
(1)任何支撑和压力位置的,作为反转的信号使用的,都要结合其他的技术指标和标准进行使用。例如价格回撤到了支撑位置进场时可以结合反转的k线或者是次级的破位结构。
(2)严格止损。这样的交易逻辑属于左侧交易,选择在转折点进场,会有非常好的盈亏比;但支撑和压力位置失效之后行情可能继续运行,不要抱有侥幸心理,严格止损,等待下次机会。


Very good working indicator. Thank you very much!