AlgoKing Chandelier Exit Indicator MT5
- インディケータ
- SQUAWKTRADEFX, LLC
- バージョン: 1.10
- アクティベーション: 5
AlgoKing Chandelier Exit Indicator (MT5)
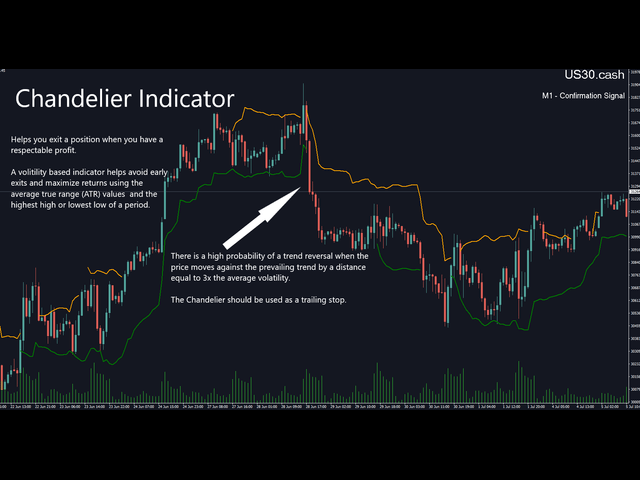
The Chandelier Exit Indicator is a volatility based indicator that maximizes returns using the Average True Range (ATR) value and the highest high or lowest low of a period.
Benefits
- Should be used as a trailing stop.
- Helps you exit a position when you have a respectable profit.
- Identifies a high probability of a trend reversal when the price moves against the prevailing trend by a distance equal to 3x the average volatility.
- Join the AlgoKing Lightning Bolt Expert Advisor support group: https://www.mql5.com/en/messages/02E3BDCF0095D801
Our other trading tools