Sniper Bullet Trender
- インディケータ
- Natasha Diedericks
- バージョン: 1.2
- アップデート済み: 15 6月 2022
- アクティベーション: 20
This indicator combines input from two trend filters and the ADX. You can change the trend line on chart to your preference.
Great for scalping and channels.
Features alert function and parameter TrendLinePeriod.
How to use:
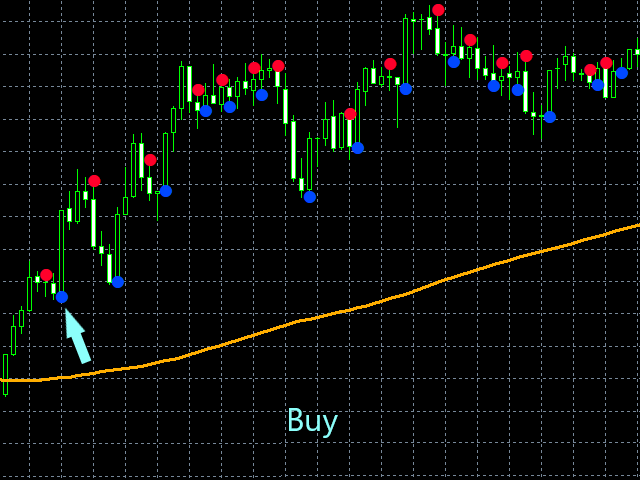
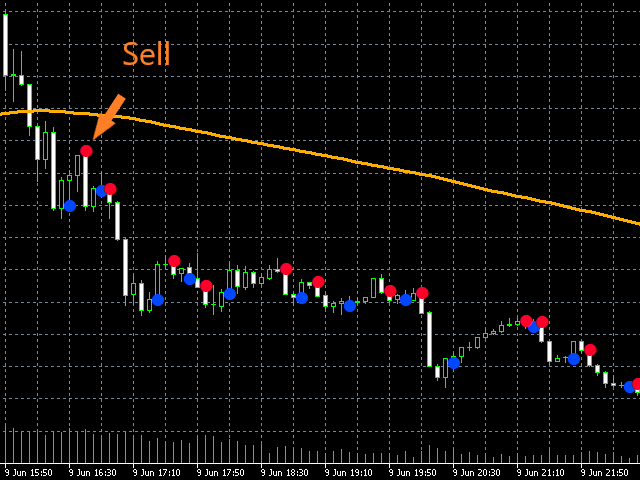
Simply attach to any chart.
Sell on red bullets, with trend line above price. Enter on bullets closest to this line.
Buy on blue bullets, with trend line below price. Enter on bullets closest to this line.
Best results when checking the higher time frames before entering trades on the lower timeframes.
Use as you see fit for your strategy.
Best results on Major Pairs, but can also be used on other pairs.
Important to note:
-
Please do not use this indicator haphazardly. Make sure it compliments your strategy.
-
Don't risk money you cannot afford to lose.
-
You use this indicator at your own risk. Please apply money management wisely.
-
Always test your strategy on a demo account before using a new indicator on a live account.


I bought this indicator because there are many interesting elements, I am a scalper and this indicator is a perfect complement