MetaBands M5
- インディケータ
- Vahidreza Heidar Gholami
- バージョン: 1.9
- アップデート済み: 21 9月 2023
- アクティベーション: 10
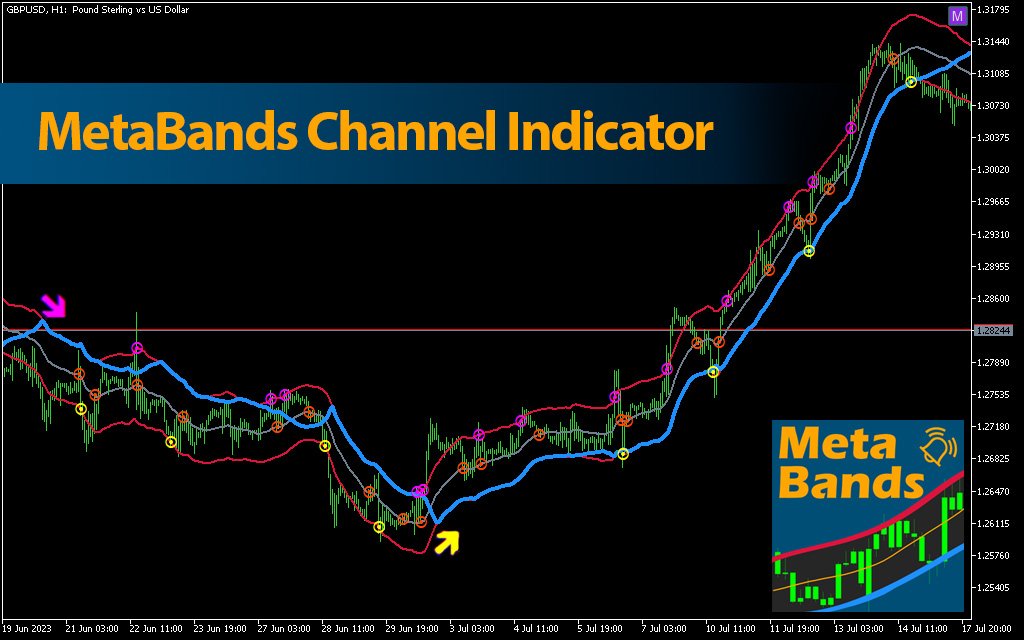
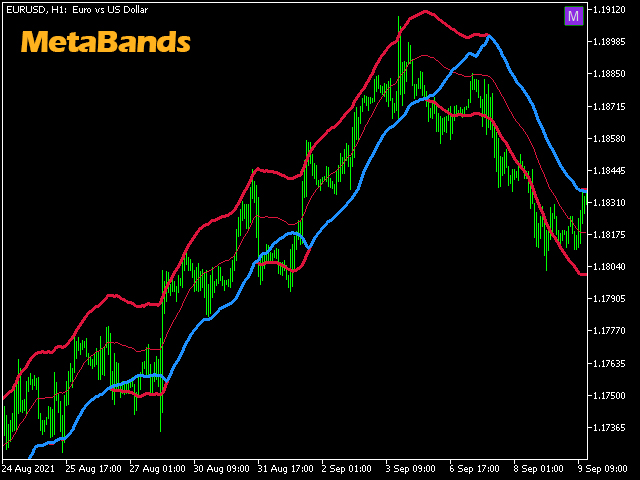
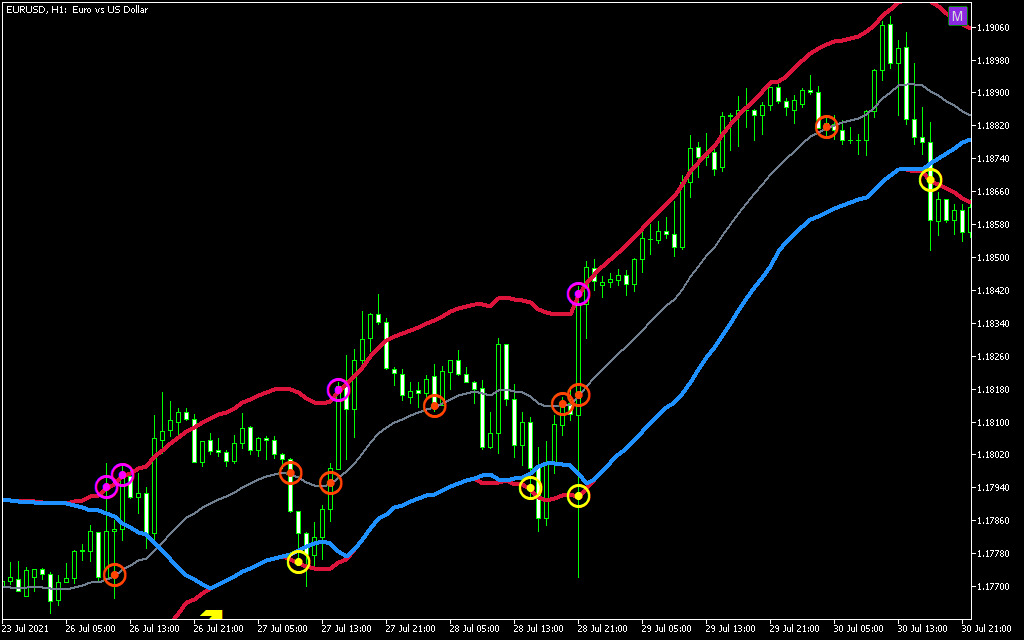
MetaBandsは、強力でユニークなアルゴリズムを使用してチャンネルを描画し、トレンドを検出して、トレーダーに取引の入出ポイントを提供することができます。チャンネル指標に加えて、強力なトレンド指標でもあります。入力パラメータを使用して新しいチャンネルを作成するために、異なるタイプのチャンネルを統合することができます。MetaBandsは、市場のイベントについてユーザーに通知するために、すべてのタイプのアラートを使用します。
特徴
- ほとんどのチャンネルアルゴリズムをサポート
- 強力なトレンド検出アルゴリズム
- 異なるタイプのチャンネルを統合する能力
- マルチタイムフレームおよびマルチカレンシー(シグナルマトリックス)
- すべてのタイプのアラート機能(サウンド、画面フラッシャー、プッシュ通知、メール、ポップアップ、矢印)
- 再描画しない
トレンド検出
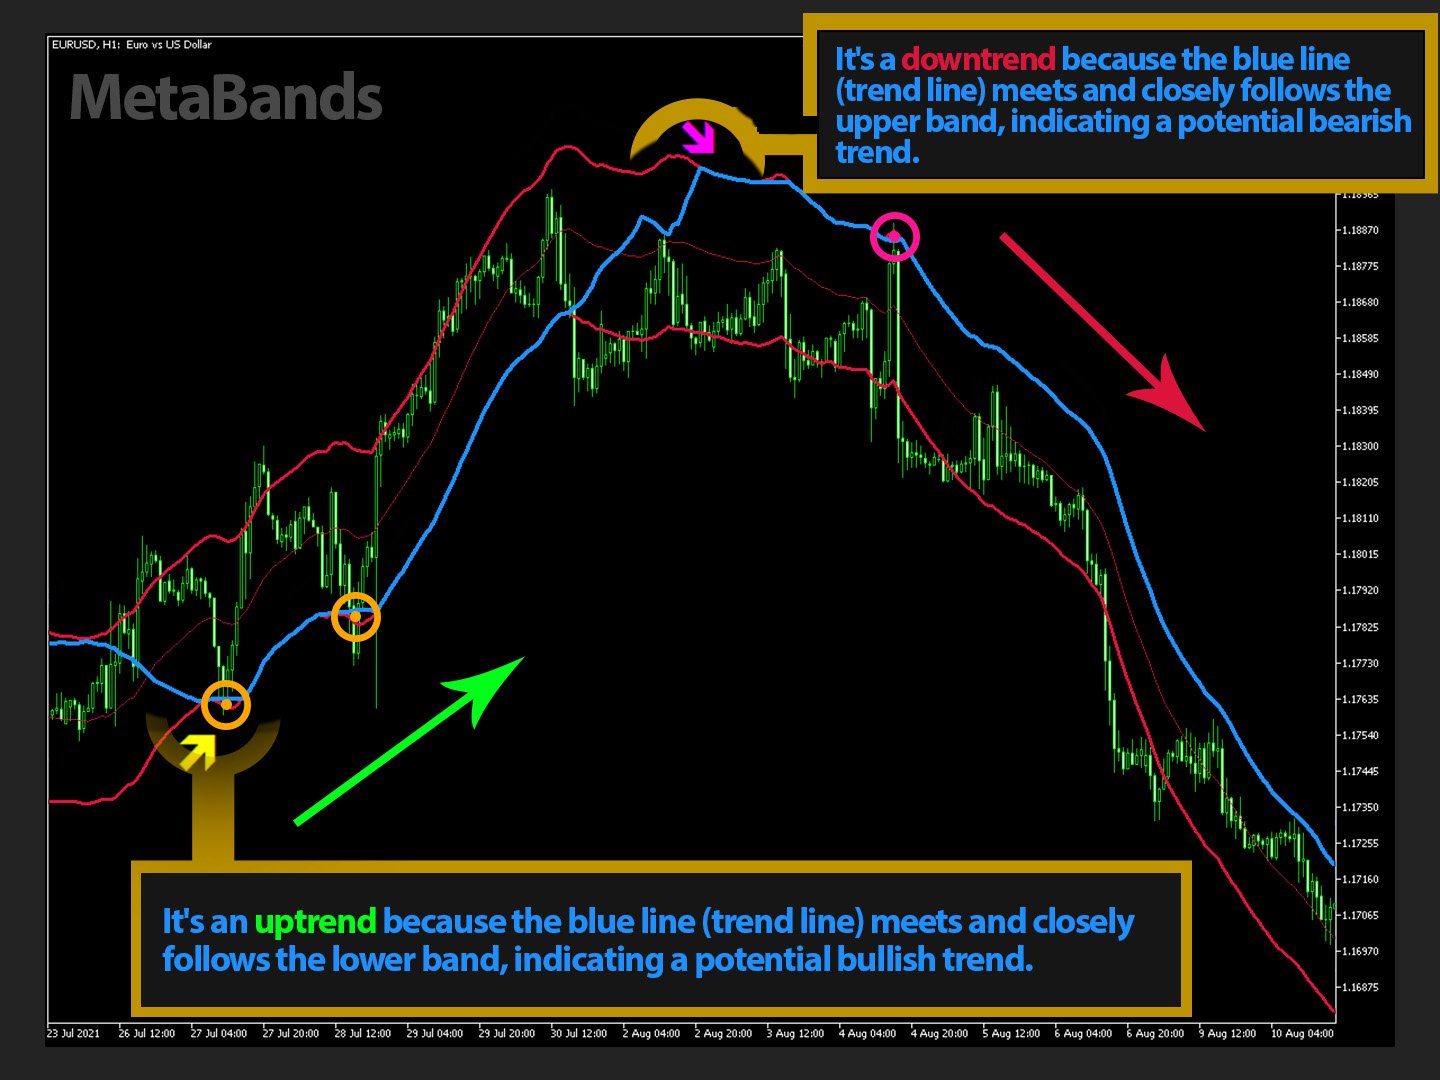
MetaBandsは、チャネル内を振動する青いラインを使用してトレンドを検出します。ラインがチャネルの上部バンドに達すると、下降トレンドの開始を示し、下部バンドに達すると上昇トレンドの開始を示します。青いラインが中心ラインに近づくと、市場はコンソリデーションにあります。
このインジケーターは、トレンドを検出する独自の方法を使用します。最初は複雑に見えるかもしれませんが、ビデオチュートリアルを見れば、その強力で簡単な方法がわかります。
エントリーとエグジットのシグナル
トレンドが変わるか、価格が上部または下部バンドを越えると、MetaBandsはインジケーターの設定で有効にできる異なる方法でトレーダーに直ちにアラートを送信します。
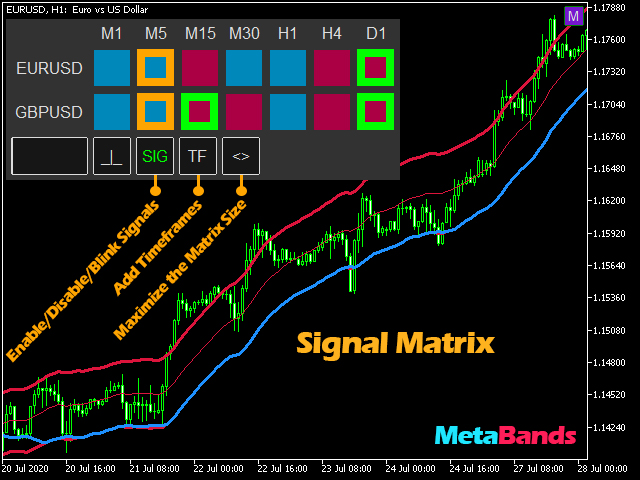
シグナルマトリックス
異なる時間枠の複数のシンボルを監視し、すべてのシグナルを1つの場所で確認するには、右上のボタンをクリックするか、キーボードのMキーを押してシグナルマトリックスを開きます。このマトリックスは、選択したシンボルと時間枠で何が起こっているかを簡単に把握できます。マトリックスにさらにシンボルを追加するには、左下のボックスを使用します。シンボルの名前を書いてエンターキーを押すと追加されます。正規表現も使用できます。たとえば、USDから始まるすべてのシンボルを追加する場合は、usd*を書いてエンターキーを押します。履歴を参照するには、_|_ボタンをクリックして、ctrlキーを押しながらマウスを移動して、異なる時間でマトリックスを表示します。
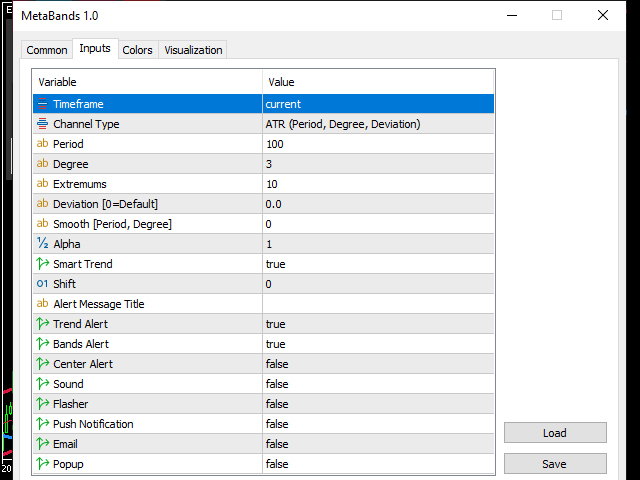
入力パラメータ
チャネルタイプ
MetaBandsは、平均真値範囲、標準偏差、回帰分析アルゴリズムを使って、ベースとなるチャネルを描画するために異なるアルゴリズムを使用します。選択されたタイプに調整する必要がある入力も、チャネルタイプの名前に含まれています。このリストに追加するアイデアがある場合は、お気軽にご連絡ください。
期間
最大ウィンドウサイズ。この入力は、複数のチャネルを1つの単一チャネルに組み合わせることができるマルチ入力フィールドです。たとえば、チャネルタイプにATRを選択し、100、50、100r、80sと入力すると、4つのチャネルが組み合わされます。最初の「100」と「50」のチャネルはATRタイプであり、3番目は100 REGチャネルであり、最後のチャネルは100 STDチャネルです。つまり、各期間の末尾にチャネルタイプの名前の最初の文字を書くことで、タイプを指定できます。
度数
チャネルで使用される移動平均のタイプを指定します。0 = SMA、1 = EMA、2 = Double EMA、3 = Triple EMA、4 = Quadruple EMA、5 = Quintuple EMAなど。
偏差
中心線からの偏差。この入力はBollinger Bandsインジケーターの偏差入力と同等です。
アルファ
トレンド検出アルゴリズムの動作を定義します。アルファが大きいほど、トレンドラインが速く動きます。比較的速いトレンドラインを取得するには、アルファの値に負の値を使用します。負のアルファは、アルゴリズムが価格の将来を予測するため、より速くなります。
スマートトレンド
スマートトレンドアルゴリズムは、トレンドノイズをキャンセルするために内部的にαを自動的に調整します。Alphaの初期値は重要です。
スムーズ[期間、次数]
チャネルをスムーズにするための多入力フィールドです。単一の値はSMAとなります。スムージング方法の次数のために別の値をカンマで入力することができます。例えば、入力100、2は、ダブルEMAを期間100で使用してチャネルをスムーズにするようにインジケーターに指示します。
各チャネルタイプの名前にリストされているすべての入力パラメータは、複数の入力フィールドです。各フィールドには、複数のコンマ区切り値が入力できます。たとえば、Period = 100, 50, 25, 12の場合、Degreeに3、2、1を入力することができます。次数の数は期間(チャネル)の数よりも少ないことに注意してください。この場合、MetaBandsは残りのチャネルに対して最後の次数を使用します。


great program You have to be a genius to write this indicator. like a magic wand .trend direction makes it look amazing