ClickDrag MT5 Drawing and moving objects
- ユーティリティ
- Sajiro- Yoshizaki
- バージョン: 1.42
- アップデート済み: 11 5月 2023
チャート上に超簡単に線を引いたり、移動したりできるツールです。
クリックしてから、ドラッグするとトレンドラインが引けます。
横に引くと価格線、縦に引くと日付線になります。
そこにある線やオブジェクトで、クリック&ドラッグすると移動できます。
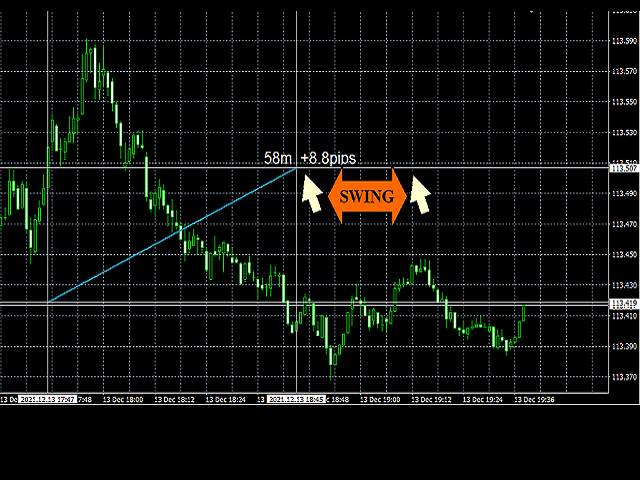
クリックしたところから、ドラッグしたところに交差線が引かれ、間の時間と価格の差が表示されます。
クリック&ドラッグしたら、左右に振ると色が変わります。
クリック&ドラッグしたら、上下に振ると削除します。
▼ クリック&ドラッグとは?
1.マウスの左ボタンを押す(カ)
2.マウスの左ボタンを放す(チ)
3.マウスの左ボタンを押す(カ)
4.左ボタンを押したまま、マウスを移動する(ツー)
この動きをすることでトレンドラインを引いたり、オブジェクトを移動したり、色を変えたり、消したりできます。
トレンドライン、価格ライン、日付ラインだけでなく、矢印や価格表示、フィボナッチ、ギャンライン、サイクルライン、図形なども移動させることができます。
▼ 他にも便利なところ
・うっかり線を引いてしまったら、チャート外でマウスボタンを離せば、線が消えます。
・中クリック&右クリックよりも簡単に差額や時間の変化を表示することができます。
・あと表示文字が大きくて見易いです。
・でも、元々動かないオブジェクトには使えません
・FXではPIPS、CFDでは円やドルで表示します
ぜひ、新感覚の描画ツールをお試しください!

Hi ! Can you give me some tips to build this by myself ? I like to add some analysis after drawing a line. Thanks !