KF Trix MT4
- インディケータ
- Sevgi Hilal Kilic
- バージョン: 1.0
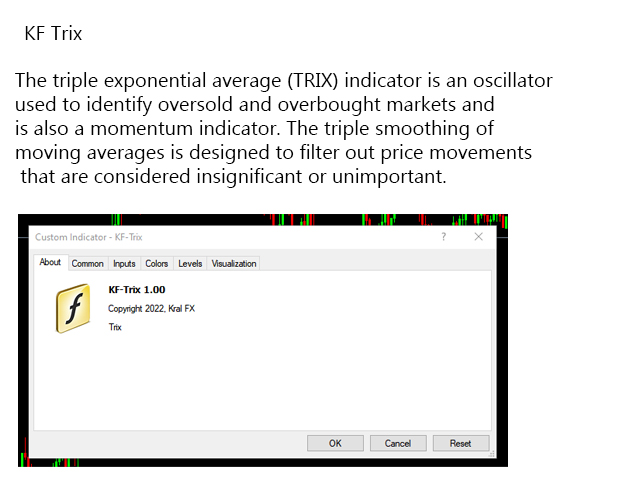
KF Trix V1.00
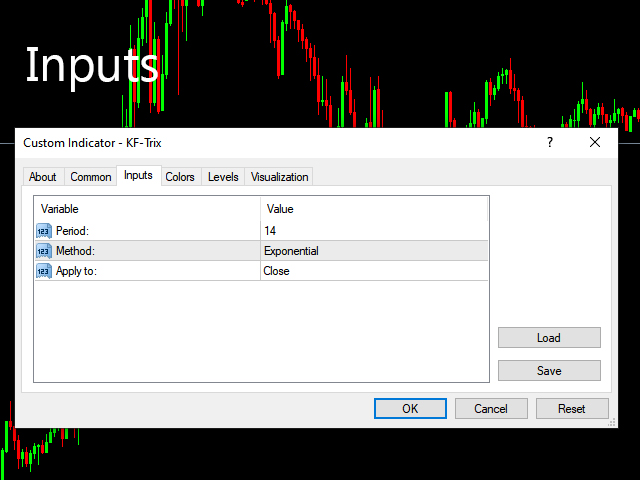
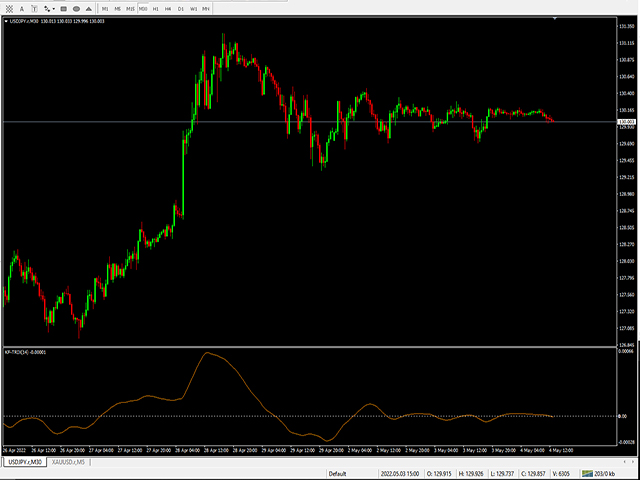
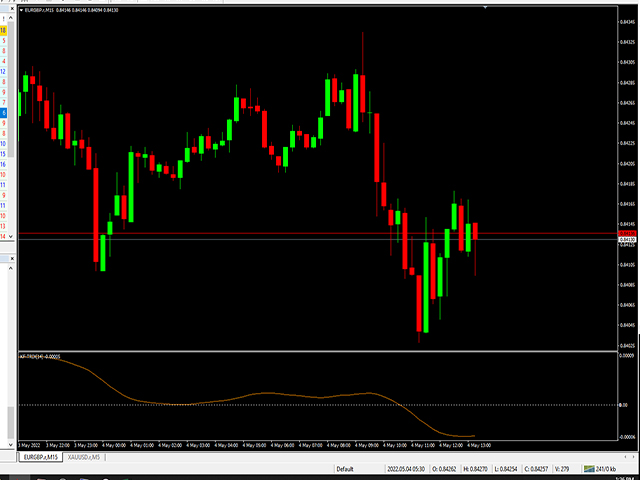
The triple exponential average (TRIX) indicator is an oscillator used to identify oversold and overbought markets and is also a momentum indicator. The triple smoothing of moving averages is designed to filter out price movements that are considered insignificant or unimportant.
About
Software details and MQL login link
Copyright 2022, Forex KRAL


Great