• 概要
  • レビュー (4)
  • コメント (2)

Comfortable MACD

5

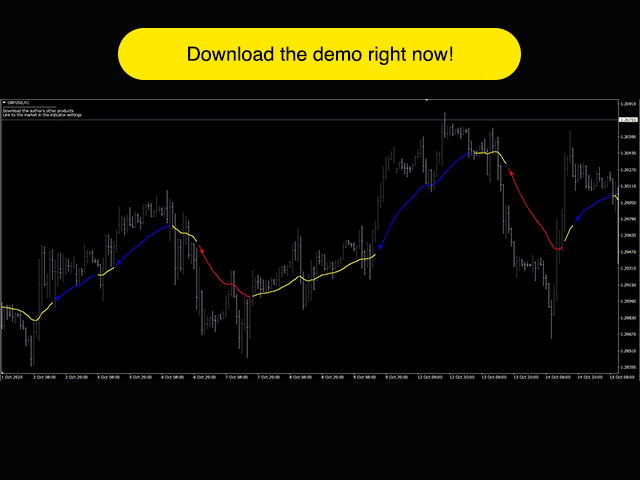
Trading with the help of the MACD indicator has become even more convenient. Flexible settings will help you choose what you really need in your trading. Use the strategy that you need - the indicator uses 3 strategies. Download the demo right now!

I recommend watching my advisor - Night Zen EA

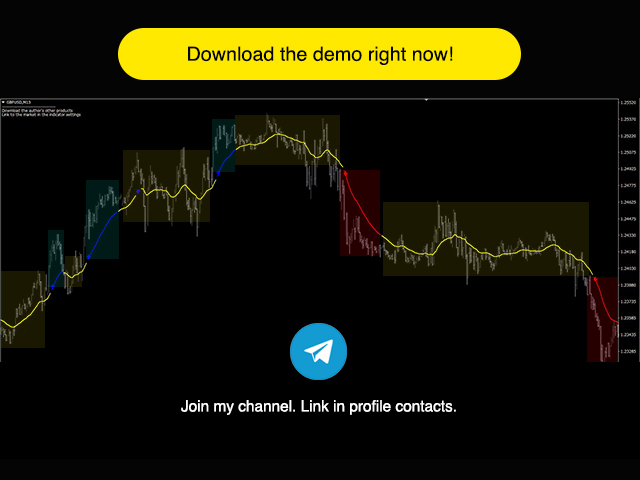
Subscribe to my telegram channel, link in my profile contacts -  my profile

See also my other products on mql5.com -  my products

Advantages of the indicator:

  • In this indicator, the interpretation of the MACD is displayed on the chart itself using the fast EMA line, the calculation of which is embedded in the MACD indicator.
  • You can use one of 3 strategies.
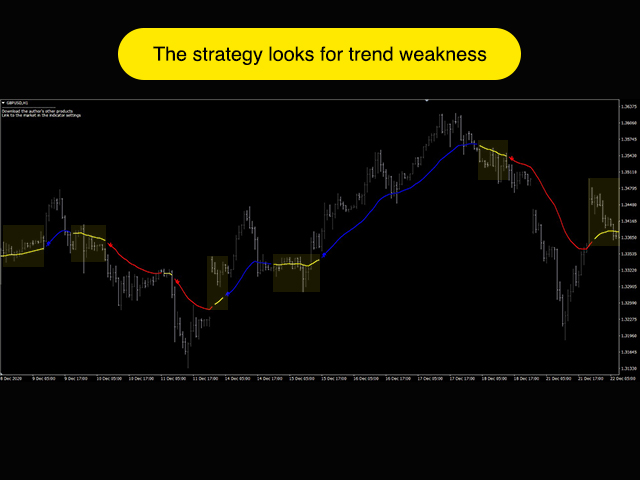
  • You can now focus not only on the MACD signals for the chosen strategy, but also on the location of the price relative to the fast EMA line, on the direction and slope of the fast EMA line.
  • Signals do not redraw their values - if an arrow appears, it will remain on the chart.
  • Receive alerts about the appearance of signals in your terminal on your PC, mobile terminal and mail.

Strategies in this indicator:

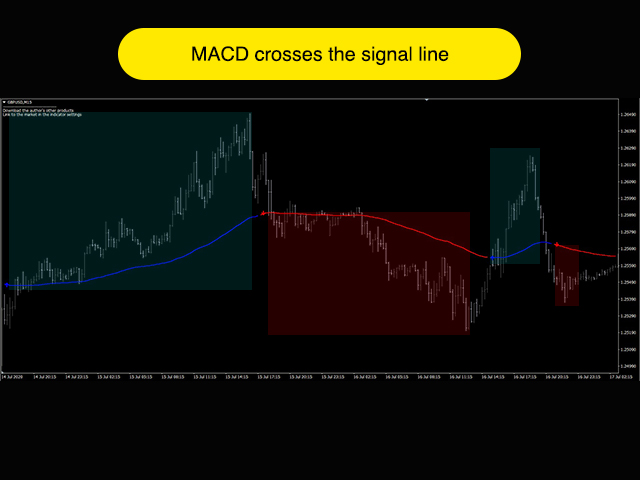
  1. The MACD line crosses the signal line
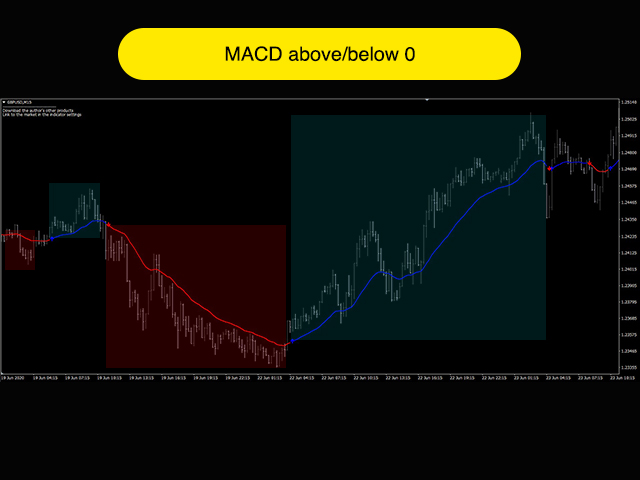
  2. The MACD line crosses level 0
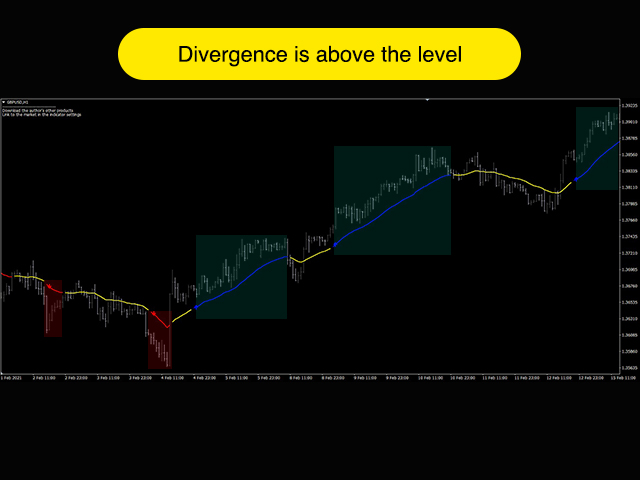
  3. The divergence of the fast and slow EMA lines above the set level (the level is set in the indicator settings in points)
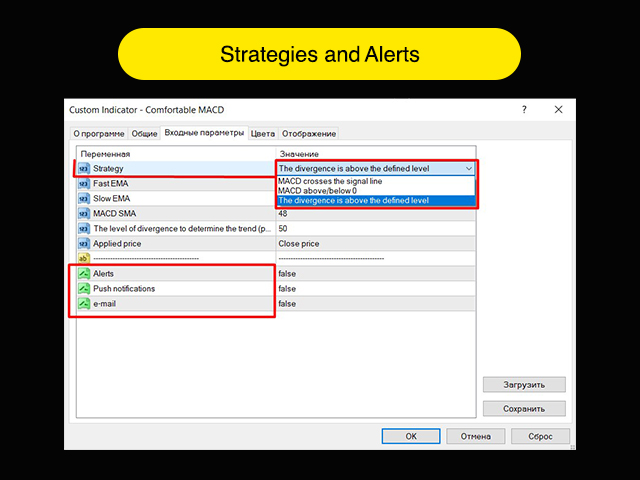
Indicator Settings:

  • Strategy - Choosing a strategy
  • Fast EMA - Fast EMA Period
  • Slow EMA - The period of slow EMA
  • MACD SMA - The period of simple averaging of the divergence values
  • The level of divergence to determine the trend (points) - The maximum level of divergence of the fast and slow EMA lines to determine the strength of the trend.
  • Applied price - The applied price in the calculation of the MACD indicator
  • Alerts - Notification functions to the terminal, mobile terminal and mail.

Customize this indicator for yourself and make successful trades on the market! I wish you a successful trade!
Download the demo!


レビュー 4
Trader mql5
1265
Trader mql5 2023.06.28 02:31 
 

This (as all the other indicators by you) is absolutely superb. Arrows do not redraw and show on start of new candle, not to confuse the user that the signal has occured during the previous candle. Well programmed with enough parameters to suit. If you can just configure the arrow to be located by users choice, that would make it perfect. The indicators are free for now, but these indicators are so good that I hope they get popular and seller can charge. I use it to confirm the price action that I see, I use all your indicators the same. One needs to understand MACD a little bit to make it useful, but thank you very much.

Niesler Fabrício
42
Niesler Fabrício 2022.09.12 16:42 
 

Excelente indicador. Me ajudou muito. Já pensou em combinar com outros? estou fazendo alguns teste bem interessantes. Um abraço.

おすすめのプロダクト
Introducing RSI Jurik—an innovative indicator designed to revolutionize your forex trading strategy by combining custom moving averages based on the Relative Strength Index (RSI) with the MetaTrader 4 indicator, RSI. Jurik moving averages are renowned for their accuracy and reliability in analyzing price movements in the forex market. They provide traders with smoother representations of price action, reducing noise and offering clearer signals for identifying trends and potential reversals.
FREE
TILLSON MOVING AVERAGE Also known as TMA or T3 indicator. It is a moving average that uses EMA and DEMA in its formula and is calculated with the 3rd degree Binomial expansion. Pros; 1-       erroneous signals encountered in other moving averages ( continuous zig zag ) has been reduced as much as possible. 2-       prevented the delays seen in classical moving averages . 3-       Very successful in trends Cons 1-       It is not effective in horizontal markets. Setting parameters; period ; Altho
FREE
MT4 用 Forex インジケーター HTF MACD オシレーター HTF は Higher Time Frame を意味します MACD インジケーター自体は、トレンド トレーディングで最も人気のあるインジケーターの 1 つです このインジケーターは、プライス アクション エントリを使用したマルチタイム フレーム トレーディング システム、または他のインジケーターとの組み合わせに最適です HTF MACD インジケーターを使用すると、Higher Time Frame の MACD を現在のチャートに添付できます --> これはプロフェッショナルなトレーディング アプローチです インジケーターにはモバイルおよび PC アラートが組み込まれています // より優れたエキスパート アドバイザーとインジケーターは、こちらで入手できます: https://www.mql5.com/en/users/def1380/seller これは、この MQL5 Web サイトでのみ提供されるオリジナル製品です。
Currency Strength Matrix (CSM) is an indicator that will show you the current strength of the major currencies in several timeframes, allowing you to sort the currencies for strength and spot possible trading setups. This indicator is ideal for scalping and in all those events of sudden big moves. How does it work? The CSM compares the value of the current moving average with the same moving average in the previous candle for all the 28 pairs and all 9 timeframes, producing a Matrix of Strengt
FREE
Heikin-Ashi-Sniper is a perfect addition to your portfolio. It is meant to be traded on EURUSD on H1 Timeframe. It uses Heikin-Ashi High and Low/High of Monthly timeframe to determine optimal entry signals while having a reasonably low drawdown More EA´s will be published shortly to complete the Portfolio. The EA Trades not very frequently it waits for the right chance and places the order. The rest of the time, your capital is free to be traded on other strategies Please see backtest results
FREE
"Capture the sleeping and waking alligator." Detect trend entrance/exit conditions - this indicator can also be tuned according to your trading style. You can adjust a confidence parameter to reduce false positives (but capture less of the trend). This is based on a modification of the Alligator indicator by Bill Williams, an early pioneer of market psychology.  2 main strategies: either the " conservative"  approach to more frequently make profitable trades (at a lower profit), or the " high r
FREE
This is one of the most popular and highly rated volatility index (VIX) indicators on the market. It provides the same readings as the VIX does for stock indexes. However, this indicator works across all asset classes.  VIX Fix Finds Market Bottoms.  This indicator is not for inexperienced traders. Use it for day and swing trading. MT5 Version -  https://www.mql5.com/en/market/product/112284 Bernard Baruch summed it out best: "Markets fluctuate." The Chicago Board Options Exchange (CBOE) Vola
FREE
This indicator is not only for trading but also for learning, thanks to it, you can learn to identify trend, support and resistance. You've probably heard about the Dow trend theory, where higher highs and higher lows indicate an uptrend, and lower highs and lower lows indicate a downtrend. This indicator determines this trend based on the Dow Theory. You just need to enter a number representing the number of candles between extremes. The optimal solution is the number 3 (H1 TF), unless you
FREE
Heikin Ashi Premium
Frederick Langemark
5 (10)
Heikin Ashi is Japanese for "average bar", and may make it easier for you to identify trends. Our version of this popular indicator adjusts the size of the candles based on the zoom level of your chart, making it appear more naturally just like the traditional candlesticks. The colors are selected based on the color scheme you use on your charts, but can be customized anyway you would like. You may also choose whether to display only the Heikin Ashi candles, or show the other selected chart as w
FREE
Rung   トレンドインジケーター。インディケータは、価格変動の主な傾向を識別し、さまざまな色でマークしますが、主な傾向に対するノイズや短期的な価格変動を排除し、反応しません。 インディケータは、市場の現在のトレンドを決定するツールです。デフォルト設定では、価格がチャネル内で移動すると、インジケーターは上昇傾向(「強気」トレンド)、インジケーターは緑色の線でマークされ、下降トレンド(「弱気」)トレンドは赤色の線でマークされます。 、インジケーターは反応しません。コリドーまたは横方向の価格変動の値は、インジケーターの設定によって調整できます。 インジケーター設定の説明 striction_points-コリドーのサイズ(ポイント単位)。 factor_smoother-平滑化係数。 アラート-ユーザーデータを含むダイアログボックスを表示します。 Text_BUY-買いシグナルのカスタムテキスト。 Text_SELL-売りシグナルのカスタムテキスト。 Send_Mail- [メール]タブの設定ウィンドウで指定されたアドレスにメールを送信します。 件名-電子メールの件名。 Send_N
FREE
MetaCOT 2 is a set of indicators and specialized utilities for the analysis of the U.S. Commodity Futures Trading Commission reports. Thanks to the reports issued by the Commission, it is possible to analyze the size and direction of the positions of the major market participants, which brings the long-term price prediction accuracy to a new higher-quality level, inaccessible to most traders. These indicators, related to the fundamental analysis, can also be used as an effective long-term filter
Zenマーケットフロー - MTFスーパートレンド MTFスーパートレンドは、任意のタイムフレームで使用できるシステムです。このマルチタイムフレームインジケーターは、1つから3つのタイムフレームのシグナルを同時に表示し、それらの整合性を示します。 スーパートレンドインジケーターを気に入っている方は、このバージョンもきっと気に入るでしょう。 インジケーターのシグナルと描画をバックテストでテストすることもでき、マルチタイムフレームのシグナルを表示することができます。 すべてのタイムフレームが同じ方向を示しているときに、インジケーターはシグナルを提供し、スクリーンショットを撮り、アラートウィンドウをポップアップし、メールやプッシュ通知をスマートフォンに送信します。 高いタイムフレームの場合、クローズしたローソク足に基づいて値を表示するか、ローソク足ごとにインジケーターの値がどのように変化したかを確認するオプションがあります。 バックテストを行いたい場合も問題ありません。インジケーターは現在のタイムフレームのローソク足に基づいて、より高いタイムフレームのローソク足をシ
This indicator shows data from 9 currency pairs by your choice from all 9 timeframes. If a digital value of the RSI is less or equal to DnLevel = 30 (or whatever number you decided to put), then a Green square will appear. This is (potentially) an Oversold condition and maybe a good time to go Long . If a digital value of the RSI is greater or equal to UpLevel = 70 (or whatever number you decided to put), then a Red square will appear. This is (potentially) an Overbought condition and maybe a go
Moving Average Trend Alert is a triple MA indicator that helps traders to identify potential market trends based on 3 MAs alignment and crossover. Moving Average Trend Alert features: Customizable short-term, medium-term, and long-term MAs. Option to filter signals based on a minimum distance between moving averages to avoid premature MAs alignment. Optional Filter of signals with RSI indicator overbought/oversold levels. Optional Filter of signals with ADX indicator. Popup, email, and phone n
FREE
Have you ever wanted to be able to catch a trend just as it is beginning? This indicator attempts to find the tops and bottoms of a trend. It uses in-built indicators and studies their reversal patterns. It cannot be used on its own it requires Stochastic(14) to confirm signal. Red for sell, Blue for buy. There are no parameters required just attach to a chart and it is ready to go. Check out other great products from  https://www.mql5.com/en/users/augustinekamatu/seller   A Winning Trading Stra
FREE
This indicator displays the signals based on the values of the classic WPR indicator. The WPR indicator can be used for determining the overbought or oversold areas on the chart. Reaching these levels means that the market can soon turn around, but it does not give signal, as in a strong trend the market can stay in the overbought or oversold state for quite a long time. As with most oscillators, the signals are generated when leaving these areas. This indicator allows to display three types of
FREE
DirectionalTrend取引インジケータは、金融市場のトレンドを明確かつ 正確に表示するために設計された革新的なツールです。このインジケータは、過去の市場データに基づき、特定の期間にわたって市場が動いている一般的な方向を特定し、表示します。このインディケータの主な目的は、市場の支配的なトレンドについて明確なシグナルを提供することで、トレーダーが十分な情報に基づいた意思決定を行えるようにすることです。直感的なインターフェースで設計されたこのインディケータは、理解しやす く使いやすいため、あらゆる経験レベルのトレーダーに適しています。シグナルはチャート上に明確に表示されるため、十分な情報に基 づいた意思決定が容易に行えます。トレーダーは、エントリーおよびエグジットシグナルの確認、トレン ドの反転ポイントの特定、ストップロスおよびテイクプロフィットレベルの 設定など、様々な方法でDirectionalTrendを使用することができます。このツールをテクニカル分析に統合することで、トレーダーはより多くの情報に基づいた決断を下し、市場での収益性を向上させることができます。直感的で使いや
FREE
The block of bars is collected under condition of divergence . If the divergence conditions are not met, the block is deleted. More precisely, the condition is the transition of the block of bars from the state of divergence to the state of convergence . Blocks are formed selectively with gaps. Gaps are characterized by the state of convergence of bars. The indicator shows the value and direction of the price in the divergence block . To determine the divergence value, see here , the line of ex
FBO Impact  is a professional yet simple to use trend following system. It detects the prevailing trend and gives entry points after pullbacks to significant price levels. To determine the trend it uses a unique filtering algorithm. Suitable for defining entry points for scalping as well as for intra-day trading. Features Works with the prevailing market trend. Suitable for all currency pairs. Ideal for all time frames but higher time frames are recommended. Does not redraw/repaint the arrows on
TDI RT Clone
Irina Polyakova
4.5 (2)
В основе индикатора TDI лежат следующие индикаторы: RSI, Moving Average, Bollinger bands, но основным из них нужно выделить RSI, весь расчет индикатора завязан от его значений. Зеленая линия (линия RSI) – сглаженные простой (по умолчанию) скользящей средней значения индикатора RSI, период сглаживания 2. Красная линия (сигнальная линия) – сглаженные простой (по умолчанию) скользящей средней значения индикатора RSI, период сглаживания 7. Синие линии – индикатор Bollinger bands по умолчанию п
FREE
This indicator idea comes from Tushar Chande called Qstick. Technical indicators quantify trend direction and strength in different ways. One way is to use the difference between close and open for each bar and to sum it up over a period of time. The formual is: Qstick (period ) = Average ((close-open ), period ) In this indicator, we can choose how to calculate body by two famous chart types. The first and default indicator settings are based on Heiken Ashi chart, and the second i
FREE
RaysFX Stochastic  L'indicatore RaysFX Stochastic è un indicatore personalizzato per la piattaforma MetaTrader 4. Caratteristiche principali: -Indicatori separati: L'indicatore viene visualizzato in una finestra separata sotto il grafico principale. -Livelli dell'indicatore: L'indicatore ha due livelli predefiniti, 20 e 80, che possono essere utilizzati come livelli di ipervenduto e ipercomprato. -Buffer dell'indicatore: L'indicatore utilizza quattro buffer per calcolare e memorizzare i suo
FREE
Indicator for working with a Trend. Trend is your friend! The digital indicator helps to find the optimal points of entry into the market, to stay in the trend as much as possible. If the trend and direction change, exit the position in time. The indicator is recommended for use on timeframes H4 and higher. Works on any trading instrument. The indicator menu contains options for fine tuning the signals and color gamut. Happy trading!
Mini FFMV Dashboard and CSM
Opengates Success International
1 (1)
Mini Forex Market-View Dashboard and Mini-CSM Mini Full Forex Market View Dashboard is a miniature creation of FULL FOREX MARKET_VIEW Custom indicator created to give the Traders a full view of what is going on in the market but in a partial matter to make it conscise. It is useful most especially for those who don't like bogus indicators or those who have a PC with limited screen size. It uses a real time data to access the market and display every bit of information needed to make a successful
This is a High Frequency Algo system that targets pull-backs and breakouts and scalps just a few pips then exits. Positions do not stay in the market for long.   The algorithm is a comprehensive and sophisticated trading system designed to optimize performance in volatile market conditions. Here are the key highlights of how the algorithm works: Adaptive Risk Management The algorithm dynamically adjusts stop-loss, take-profit, and trailing stop levels based on the current market spread and vola
FREE
Non-proprietary study of Joe Dinapoli used for trend analysis. The indicator gives trend signals when the fast line penetrates the slow line. These signals remain intact until another penetration occurs. The signal is confirmed at the close of the period. It is applicable for all timeframes.   Inputs lnpPeriod: Period of moving average. lnpSmoothK: %K period. lnpSmoothD: %D period.                                       *****************************************************************************
FREE
It is another simple information indicator. This indicator shows the current spread of a financial instrument and the value of one point with a volume of 0.10 lot. About the Spread Spread is the difference between the Ask and the Bid price of an asset in the stock or currency exchange. Let's refer to Central Banks and currency exchange in these banks, in order to understand why Spread is so important in currency trading. In Central Banks, we always see the difference between the buying and the
FREE
This is a self-explanatory indicator - do nothing when the current price in the "fence" (flat) mode. Definition of a flat market: A market price that is neither Up nor Down. The input parameter  counted_bars  determines on how many bars the indicator's lines will be visible starting from the current Bar backward. The input parameter  barsNum  is used as a Period for aqua "fence" calculation.
Advanced version of CyberZingFx Volume Plus, the ultimate MT4 indicator for traders seeking highly accurate buy and sell signals. With an additional strategy and price action dot signals that enhances its effectiveness, this indicator offers a superior trading experience for professionals and beginners alike. The CyberZingFx Volume Plus Advanced version combines the power of volume analysis and historical price data with an additional strategy, resulting in even more precise and reliable signals
The Multi MA Trend Change MT4 indicator is designed to help traders identify and capitalize on trend shifts with precision. By monitoring multiple moving averages, it highlights areas where trends are either gaining strength or beginning to reverse. This makes it an excellent tool for spotting early trend changes and anticipating market movements before they become apparent. The indicator excels in identifying potential retracement entries, ensuring that traders can catch pullbacks during establ
このプロダクトを購入した人は以下も購入しています
Gann Made Easy は、ミスター・ギャンの理論を使用した取引の最良の原則に基づいた、プロフェッショナルで使いやすい外国為替取引システムです。 W・D・ガン。このインジケーターは、ストップロスとテイクプロフィットレベルを含む正確な買いと売りのシグナルを提供します。 PUSH通知を利用して外出先でも取引可能です。 購入後はご連絡ください!私の取引のヒントと素晴らしいボーナスインジケーターを無料で共有します! おそらく、ギャンの取引手法についてはすでに何度も聞いたことがあるでしょう。通常、ギャンの理論は初心者のトレーダーだけでなく、すでにある程度の取引経験がある人にとっても非常に複雑なものです。なぜなら、ギャンの取引手法は理論的にはそれほど簡単に適用できるものではないからです。私はその知識を磨き、最良の原則を私の外国為替インジケーターに組み込むために数年を費やしました。 このインジケーターは非常に簡単に適用できます。必要なのは、それをチャートに添付し、簡単な取引推奨事項に従うだけです。このインジケーターは常に市場分析の仕事を行い、取引の機会を探します。適切なエントリーポイントを検出
指示する     ロシア     -        utilizar con   el indicador の ESP 推奨事項 -   TPSpro トレンド プロフェッショナル版 -   MT5のバージョン 最も重要なことは、将来においても最も重要なことです。 機能のプリンシパル: ゾーンのほとんどは、ベンダーとコンプラドールによってアクティブ化されます。 状況を直感的に把握できるよう、初期の衝動を修正します。 LOGIC AI: MUESTRA zonas (círculos) parabuscar puntos de entrada cuando se activa una plantilla 視覚的に優れた視覚効果があり、最も重要な機能がすべて揃っていることに注意してください。 優れたニベレス/ゾーンの視覚化 (modo MTF) 世界で最も人気のある場所/ゾーンです。これを使用するのに最適な方法です (   TPSproTREND PRO   )。 アルゴリズム プロフェッショナル セパラド パソ ア パソ パラ オペラ それは、オペラハウスやコントラ・デ・エラの指導におい
Gold Stuff
Vasiliy Strukov
4.89 (239)
Gold Stuff は、金専用に設計されたトレンド指標であり、あらゆる金融商品にも使用できます。 インジケーターは再描画せず、遅れません。 推奨時間枠 H1. それインディケータでフルオートExpert Advisor EA Gold Stuffが動作します。 あなたは私のプロフィールでそれを見つけることができます. 設定と個人的なボーナスを得るために、購入後すぐに私に連絡してください! トレンド スキャナーの強力なサポートを利用して、無料のインジケーターを入手し、プライバシーを守ります。あーみー!   設定 矢印を描く - オンオフ。 チャートに矢印を描く。 アラート - 可聴アラートのオンオフ。 メール通知 - オンオフ。 電子メール通知。 プチ通知 - オンオフ。 プッシュ通知。 次に、色域を調整します。 Gold Stuff は、金専用に設計されたトレンド指標であり、あらゆる金融商品にも使用できます。 インジケーターは再描画せず、遅れません。 推奨時間枠 H1. それインディケータでフルオートExpert Advisor EA Gold Stuff
まず第一に、この取引インジケーターは再描画されず、再描画されず、遅延しないことを強調する価値があります。これにより、手動取引とロボット取引の両方に理想的なものになります。 ユーザーマニュアル:設定、入力、戦略。 アトミックアナリストは、価格の強さとモメンタムを利用して市場でより良いエッジを見つけるためのPA価格アクションインジケーターです。ノイズや誤ったシグナルを除去し、取引ポテンシャルを高めるための高度なフィルターを備えています。複雑なインジケーターの複数のレイヤーを使用して、アトミックアナリストはチャートをスキャンし、複雑な数学的計算をシンプルなシグナルと色に変換します。これにより、どのような初心者トレーダーでも理解して使用し、一貫した取引の決定を行うことができます。 「アトミックアナリスト」は、新規および経験豊富なトレーダー向けにカスタマイズされた包括的な取引ソリューションです。プレミアムインジケーターとトップノッチの機能を1つの取引戦略に組み合わせ、すべてのタイプのトレーダーにとって汎用性のある選択肢にします。 デイリートレーディングとスキャルピング戦略:高
Trend Punch
Mohamed Hassan
4.95 (19)
This indicator is unstoppable when combined with our other indicator called  Support & Resistance . After purchase, send us a message and you will get it   for  FREE as a BONUS! Introducing Trend Punch , the revolutionary forex trend indicator that will transform the way you trade! Trend Punch is uniquely designed to provide precise buy and sell arrows during strong market trends, making your trading decisions clearer and more confident. Whether you're trading major currency pairs or exotic sym
TPSpro TREND PRO は 、市場を自動的に分析し、トレンドとその各変化に関する情報を提供し、再描画せずに取引に参加するためのシグナルを提供するトレンド指標です。 インディケータは各ローソク足を使用し、個別に分析します。さまざまなインパルス(アップまたはダウンインパルス)を指します。通貨、仮想通貨、金属、株、指数の取引への正確なエントリーポイント! バージョンMT5                   インジケーターの完全な説明   インジケーター -   RFI LEVELS と併用することをお勧めします。 主な機能: レンダリングなしで正確な入力信号! シグナルが表示された場合、それは関連性を維持します。これは、シグナルを提供してからそれを変更する可能性があり、入金時の資金の損失につながる可能性があるリドローインジケーターとの重要な違いです。より高い確率と精度で市場に参入できるようになりました。矢印が表示された後、ターゲットに達する (利益確定) か反転シグナルが表示されるまで、ローソク足を色付けする機能もあります。 STOP LOSS / TAKE PROFIT
MetaBands M4
Vahidreza Heidar Gholami
5 (2)
MetaBandsは、強力でユニークなアルゴリズムを使用してチャンネルを描画し、トレンドを検出して、トレーダーに取引の入出ポイントを提供することができます。チャンネル指標に加えて、強力なトレンド指標でもあります。入力パラメータを使用して新しいチャンネルを作成するために、異なるタイプのチャンネルを統合することができます。MetaBandsは、市場のイベントについてユーザーに通知するために、すべてのタイプのアラートを使用します。 特徴 ほとんどのチャンネルアルゴリズムをサポート 強力なトレンド検出アルゴリズム 異なるタイプのチャンネルを統合する能力 マルチタイムフレームおよびマルチカレンシー(シグナルマトリックス) すべてのタイプのアラート機能(サウンド、画面フラッシャー、プッシュ通知、メール、ポップアップ、矢印) 再描画しない トレンド検出 MetaBandsは、チャネル内を振動する青いラインを使用してトレンドを検出します。ラインがチャネルの上部バンドに達すると、下降トレンドの開始を示し、下部バンドに達すると上昇トレンドの開始を示します。青いラインが中心ラインに近づくと、市場はコンソ
- Real price is 80$ - 40% Discount ( It is 49$ now ) Contact me for instruction, add group and any questions! Related EA Product: Bitcoin Expert Introduction The breakout and retest strategy is traded support and resistance levels. it involves price breaking through a previous level.  The break and retest strategy is designed to help traders do two main things, the first is to avoid false breakouts. Many false breakouts start with a candlestick that breaks out of a level but ends with an immedi
FX Volume
Daniel Stein
4.58 (33)
mql5と Telegramの モーニング・ブリーフィングで、詳細とスクリーンショットを含む毎日のマーケット・アップデートをご覧 ください! FX Volumeは、ブローカーの視点から市場のセンチメントをリアルに洞察する、最初で唯一の出来高インジケーターです。 ブローカーのような機関投資家が外国為替市場でどのようなポジションをとっているか、COTレポートよりもはるかに速く、素晴らしい洞察を提供します。 この情報をチャート上で直接見ることは、あなたの取引にとって真のゲームチェンジャーであり、画期的なソリューションです。 以下のようなユニークなマーケットデータ洞察から利益を得てください。 比率は 、通貨のロングポジションとショートポジションの比率をパーセントで表示します。 比率の変化は 、選択した期間内のロング比率とその変化率を表示します。 Volumes Totalは 、通貨の取引量(ロングとショート)の合計をロット単位で表示します。 Volumes Long :全通貨のロングポジションの取引量を表示します。 Volumes(ショート )は、全通貨のショートポジションの取引量を表示
An exclusive indicator that utilizes an innovative algorithm to swiftly and accurately determine the market trend. The indicator automatically calculates opening, closing, and profit levels, providing detailed trading statistics. With these features, you can choose the most appropriate trading instrument for the current market conditions. Additionally, you can easily integrate your own arrow indicators into Scalper Inside Pro to quickly evaluate their statistics and profitability. Scalper Inside
Trend Screener
STE S.S.COMPANY
4.8 (87)
トレンドインジケーター、1つのツールに組み込まれたすべての重要なトレンド機能を備えたトレンドトレーディングとフィルタリングのための画期的なユニークなソリューション! これは、すべてのシンボル/商品(外国為替、商品、暗号通貨、インデックス、株式)で使用できる100%再描画されていないマルチタイムフレームおよびマルチ通貨インジケーターです。 期間限定オファー: サポートおよびレジスタンス スクリーナー インジケーターは、たった 50 ドルで永久的にご利用いただけます。(元の価格 250 ドル) (オファー延長) トレンドスクリーナーは、チャート内のドットで矢印トレンドシグナルを提供するインジケーターに続く効率的なインジケーターです。 トレンド分析インジケーターで使用できる機能: 1.トレンドスキャナー。 2.最大利益分析を備えたトレンドライン。 3.トレンド通貨強度メーター。 4.アラート付きのトレンド反転ドット。 5.アラート付きの強いトレンドドット。 6.トレンド矢印 毎日の分析例、毎日のシグナルパフォーマンス...など、トレンドスクリーナーインジケーターを使用して、ここで見つけること
Enigmera
Ivan Stefanov
5 (3)
エニグメラ:市場の中核 https://www.enigmera.com はじめに このインディケータと取引システムは、金融市場に対する驚くべきアプローチです。ENIGMERAは、フラクタルサイクルを使用して、サポートとレジスタンスレベルを正確に計算します。本格的な蓄積局面を示し、方向性と目標を示します。 トレンド中でも調整中でも機能するシステムです。 どのように作動するのか? ENIGMERAは、支持線・抵抗線、目標線、乖離線の3つのラインで構成されています。このシステムは、過去のデータを現在と未来に外挿する典型的な市場指標とは異なり、現在の完全な画像を提供します。支持線上にある場合、それは本当の支持を意味し、抵抗線上にある場合、それは本当の抵抗を意味する。ある水準が破られた場合、それはトレンドの変化を意味する。再描画はしない。 市場は常に進化しているため、ENIGMERAはその評価ツールを適応させ、定期的に戦略を修正しています。  これにより、すべてのシナリオが徹底的に評価されることが保証されます。この市場指標の独自性は、その能力を見れば明らかです。  ENIGM
mql5と Telegramの モーニング・ブリーフィングで、詳細とスクリーンショットを含む毎日のマーケット・アップデートをご覧 ください! FX Power MT4 NGは 、長年の人気を誇る通貨強度計FX Powerの次世代モデルです。 この次世代ストレングスメーターは何を提供するのでしょうか?初代FXパワーの魅力すべて プラス GOLD/XAUの強さ分析 より正確な計算結果 個別に設定可能な分析期間 カスタマイズ可能な計算上限値により、さらに優れたパフォーマンスを実現 もっと見たい人のための特別なマルチインスタンス設定 すべてのチャートでお好みの色を無限に設定可能 数え切れないほどの通知オプションにより、重要なことを見逃すことはありません。 Windows 11とmacOSのスタイルで角を丸くした新しいデザイン 魔法のように動くインジケーターパネル FXパワーの主な機能 すべての主要通貨の強さの完全な履歴 すべての時間枠における通貨の強さの履歴 すべてのブローカーとチャートで同一の計算結果 100%信頼できるリアルタイム計算 -> リペイントなし ドロップダウン・リストから
Dynamic Forex28 Navigator - The Next Generation Forex Trading Tool CURRENTLY 49% OFF. Dynamic Forex28 Navigator is the evolution of our long-time, popular indicators, combining the power of three into one: Advanced Currency Strength28 Indicator  (695 reviews) + Advanced Currency IMPULSE with ALERT  (520 reviews) + CS28 Combo Signals (recent Bonus) Details about the indicator   https://www.mql5.com/en/blogs/post/758844 What Does The Next-Generation Strength Indicator Offer? Everything you love
現在20%OFF! 初心者やエキスパートトレーダーのためのベストソリューション! このダッシュボードソフトウェアは、28の通貨ペアで動作しています。それは私達の主要な指標(高度な通貨の強さ28と高度な通貨インパルス)の2に基づいています。それは全体の外国為替市場の大きい概観を与えます。それは、すべての(9)時間枠で28の外国為替ペアのための高度な通貨の強さの値、通貨の動きの速度と信号を示しています。チャート上で1つのインディケータを使用して市場全体を観察し、トレンドやスキャルピングの機会をピンポイントで見つけることができたら、あなたのトレードがどのように改善されるか想像してみてください。 このインディケータには、強い通貨と弱い通貨の識別、潜在的な取引の識別と確認がより簡単になるような機能が搭載されています。このインディケータは、通貨の強さや弱さが増加しているか減少しているか、また、すべての時間枠でどのように機能しているかをグラフィカルに表示します。 新機能として、現在の市場環境の変化に適応するダイナミックなマーケットフィボナッチレベルが追加され、すでに当社のAdvan
Bomb Bank Signal
Igor Pereira Calil
5 (1)
Bomb Bank シグナル: MetaTrader 4 の信頼度インジケーター Bomb Bank Signal は、金融市場で最も関連性の高いトレンドを特定するように設計された MetaTrader 4 の強力なインジケーターです。動きを正確に予測するツールをお探しなら、Bomb Bank が最適です。 仕組み: このインジケーターは、出来高分析、ローソク足終値、対称トレンドという 3 つの異なる方法を組み合わせて、売買の機会を検出してシグナルを送ります。 Bomb Bank は、買いの機会を特定するときは「爆弾」のようなものであり、売りシグナルを検出するときは「ドクロ」のようなものです。 ボムバンクはなぜ違うのですか? 完全な信頼性: Bomb Bank Signal は信号を削除しません。一度シグナルが発せられると、シグナルは残り続けるので、チャンスを逃すことはありません。 極めて高い精度: Bomb Bank は誤った信号を送信しません。リアルタイムで最新情報を更新し、市場の進化に合わせて調整しながら、以前のシグナルの透明性を維持します。 ライブアップデ
トレンドカッターは、M1 や M5 などの下位時間枠を含むあらゆる時間枠で使用できるトレンド指標です。このインジケーターは日中取引を好むトレーダーにとって理想的であり、長期取引を好むトレーダーにも役立ちます。このインジケーターは、取引システムの基礎として、またはスタンドアロンの取引ソリューションとして使用できます。 このインジケーターは、PUSH 通知を含むあらゆるタイプのアラートを提供します。 インジケーターの使い方はとても簡単です。信号に従えばいいだけです。また、このインジケーターのすべてのユーザーに、このメソッドをできるだけ効率的に使用するのに役立つ追加のインジケーターも無料で提供します。 取引のヒントと素晴らしいボーナスを入手するには、購入後にご連絡ください。
Chart Patterns All-in-One インジケーターは、トレーダーがテクニカル分析で一般的に使用されるさまざまなチャートパターンを視覚化するのに役立ちます。このインジケーターは市場の潜在的な動きを特定するのに役立ちますが、収益性を保証するものではありません。購入前にデモモードでテストすることをお勧めします。 現在のオファー : 「Chart Patterns All in One」インジケーターが50%割引。 含まれるパターン : 1-2-3 パターン : 3つの主要なポイント(高値または安値)を使用して市場の反転を検出します。 買い : 2つの連続する安値の後に、前の高値よりも低い高値が出現。 売り : 2つの連続する高値の後に、前の安値よりも高い安値が出現。 可視化 : 特定されたポイントを線と矢印で接続。 ダブルトップとダブルボトム : 価格がほぼ同じ2つの連続した高値(ダブルトップ)または安値(ダブルボトム)を形成したときに、反転の可能性を示します。 ダブルトップ : ベアリッシュな反転。 ダブルボトム : ブルリッシュな反転。 可視化 : ピークまたは谷を線で接
通貨強さウィザードは、取引を成功させるためのオールインワン ソリューションを提供する非常に強力な指標です。このインジケーターは、複数の時間枠のすべての通貨のデータを使用して、このまたはその外国為替ペアのパワーを計算します。このデータは、使いやすい通貨インデックスと通貨パワーラインの形式で表され、特定の通貨のパワーを確認するために使用できます。 必要なのは、取引したいチャートにインジケーターを接続することだけです。インジケーターは、取引する通貨の実際の強さを示します。このインジケーターは、トレンドに合わせて取引するときに有利に利用できる売買高の圧力の極値も示します。このインジケーターには、フィボナッチに基づく可能なターゲットも表示されます。 このインジケーターは、PUSH 通知を含むあらゆるタイプのアラートを提供します。 購入後ご連絡下さい。私の取引のヒントをあなたと共有し、素晴らしいボーナスインジケーターを無料で提供します! 幸せで有益な取引をお祈りします。
TakePropips Donchian Trend Pro
Eric John Pajarillaga Aldana
4.44 (16)
TakePropips Donchian Trend Pro   (MT4) は、ドンチャン チャネルを使用してトレンドの方向を自動的に検出し、エントリーとエグジットの取引シグナルを提供する強力で効果的なツールです! この多機能インジケーターには、トレンド スキャナー、取引シグナル、統計パネル、スクリーナー、取引セッション、およびアラート履歴ダッシュボードが含まれます。取引シグナルを提供し、チャートを分析する時間を節約するように設計されています! ユーザー マニュアルとインストール ガイドは、ブログ投稿 (   https://www.mql5.com/en/blogs/post/751368   ) からダウンロードできます。 今日は 50% オフ! 98ドルから49ドルに値下げ! このインジケーターは、ストラテジー テスターでテストできます (ビジュアル モードを有効にします)。 詳細については、説明の下にあるビデオ チュートリアルも利用できます。 ご不明な点やサポートが必要な場合は、私に連絡してください。 TakePropips Donchian Trend Pro イン
Stratos Pali Indicator   is a revolutionary tool designed to enhance your trading strategy by accurately identifying market trends. This sophisticated indicator uses a unique algorithm to generate a complete histogram, which records when the trend is Long or Short. When a trend reversal occurs, an arrow appears, indicating the new direction of the trend. Important Information Revealed Leave a review and contact me via mql5 message to receive My Top 5 set files for Stratos Pali at no cost! D
現在20%OFF! このダッシュボードは、複数のシンボルと最大9つのタイムフレームで動作するソフトウェアの非常に強力な部分です。 このソフトは、弊社のメインインジケーター(ベストレビュー:Advanced Supply Demand)をベースにしています。    Advanced Supply Demand ダッシュボードは、素晴らしい概要を提供します。それは示しています。  ゾーン強度評価を含むフィルタリングされた需給値。 ゾーン内/ゾーンへのPips距離。 ネストされたゾーンがハイライトされます。 選択されたシンボルの4種類のアラートを全ての(9)時間枠で提供します。 それはあなたの個人的なニーズに合わせて高度に設定可能です。 あなたの利益! すべてのトレーダーにとって最も重要な質問です。 市場に参入するのに最適なレベルはどこか? 成功のチャンスとリスク/リターンを得るために、強力な供給/需要ゾーン内またはその近くで取引を開始します。 損切りの最適な位置はどこですか? 最も安全なのは、強力な供給/需要ゾーンの下/上にストップを置くことで
ブレーカートレーダーになり、価格が反転すると市場構造からの利益が変化します。 注文ブロックブレーカーインジケーターは、トレンドまたは価格の動きが枯渇に近づいており、逆転の準備ができていることを識別します。通常、反転または大規模なプルバックが発生しようとしているときに発生する市場構造の変化について警告します。 この指標は、ブレイクアウトと価格の勢いを識別する独自の計算を使用します。使い果たされる可能性のあるポイントの近くで新しい高値が形成されるたびに、インディケーターはその高値の作成を担当する最後の注文ブロックを描きます。次に、移動する価格とともに注文ブロックを追跡します。その後、価格が反対方向にシフトし、その注文ブロックを突破すると、新しい市場構造を作成し、トレンドまたは大きな後退の可能性のある反転の開始を警告します。 注文ブロックは、高値/安値が作成される前の最後の反対色のろうそくであり、価格がこれらの重要な領域を下抜けすると、トレンドの短期的ま​​たは長期的な反転の兆候です。 特徴 重要な枯渇点での市場構造の変化を警告します 価格が使い果たされるレベルに近づくと、
現在26%オフ 初心者やエキスパートトレーダーに最適なソリューション! このインジケーターは、独自の機能と新しい計算式を取り入れた、ユニークで高品質、かつ手頃な価格のトレーディングツールです。たった1枚のチャートで28の為替ペアの通貨強度を読み取ることができます。新しいトレンドやスキャルピングチャンスの引き金となるポイントを正確に特定することができるので、あなたのトレードがどのように改善されるか想像してみてください。 ユーザーマニュアルはこちら  https://www.mql5.com/en/blogs/post/697384 これが最初の1本、オリジナルだ! 価値のないクローンを買わないでください。 特別な サブウィンドウの矢印で強い通貨の勢いを表示 GAPがあなたのトレードを導く! 基準通貨や気配値が売られすぎ・買われすぎのゾーン(外相フィボナッチレベル)にあるとき、個別チャートのメインウィンドウに警告表示。 通貨がレンジの外側から反落した場合、プルバック/リバーサルのアラート。 クロスパターンの特別なアラート 複数の時間枠を選択可能で、トレンドを素早く
まず第一に、この取引ツールはノンリペイント、ノンリドロー、ノンラグの指標であり、プロの取引に理想的ですことを強調する価値があります。 オンラインコース、ユーザーマニュアル、デモ。 スマートプライスアクションコンセプトインジケーターは、新米から経験豊富なトレーダーまで、非常 に強力なツールです。Inner Circle Trader AnalysisやSmart Money Concepts Trading Strategiesなど、20以上の有用な指標を1つに組み合わせています。このインジケーターはスマートマネーコンセプトに焦点を当て、大手機関の取引方法を提供し、彼らの動きを予測するのに役立ちます。 特に、流動性分析に優れており、機関がどのように取引しているかを理解しやすくしています。市場のトレンドを予測し、価格の動きを慎重に分析するのに優れています。機関の戦略とトレードを合わせることで、市場の動向についてより正確な予測ができます。このインジケーターは多目的であり、市場構造を分析し、重要な注文ブロックを特定し、さまざまなパターンを認識するのに優れています。 このインジケー
IX Powerは 、FX Powerの無敵の精度をついにFX以外のシンボルにも提供します。 お気に入りの指数、株式、コモディティ、ETF、さらには暗号通貨の短期、中期、長期のトレンドの強さを正確に判断します。 お使いの端末が提供する すべてを分析する ことができます。ぜひお試しいただき、取引 タイミングが大幅に改善 されることをご体験ください。 IXパワーの主な特徴 100%正確で再描画されない計算結果 - ターミナルで利用可能なすべての取引シンボルに対して 予め設定され、さらに個別に設定可能な強度分析期間のドロップダウン選択 Eメール、メッセージ、モバイル通知による無数の通知オプション EAリクエストのためのアクセス可能なバッファ カスタマイズ可能な計算制限により、さらに優れたパフォーマンスを実現 もっと見たい人のための特別なマルチインスタンス設定 すべてのチャートでお好みの色を無限に設定可能 Windows 11とmacOSのスタイルで角を丸くした新しいパネルデザイン サブ・ウィンドウとメイン・チャートの間をシームレスに移動する、魔法のように動く
現在31%オフ! 初心者やエキスパートトレーダーに最適なソリューション! このインジケータは、独自の機能と秘密の数式を組み込んだ、ユニークで高品質かつ手頃な価格のトレーディングツールです。たった1枚のチャートで28の通貨ペアのアラートを表示します。新しいトレンドやスキャルピングチャンスの引き金となるポイントを正確に把握することができるので、あなたのトレードがどのように改善されるか想像してみてください! 新しい基本的なアルゴリズムに基づいて構築されているため、潜在的な取引の特定と確認がより簡単になります。これは、通貨の強さや弱さが加速しているかどうかをグラフィカルに表示し、その加速のスピードを測定するためです。加速すると物事は明らかに速く進みますが、これはFX市場でも同じです。つまり、反対方向に加速している通貨をペアにすれば、利益を生む可能性のある取引を特定することができるのです。 通貨の勢いを示す縦の線と矢印は、あなたの取引の指針となるでしょう。 ダイナミックマーケットフィボナッチ23レベルはアラートトリガーとして使用され、市場の動きに適応します。もしインパルスが黄色
このダッシュボードは、市場構造反転インジケーターで使用するためのアラートツールです。主な目的は、特定の時間枠での取消の機会と、インジケーターと同様にアラートの再テスト(確認)についてアラートを出すことです。ダッシュボードは、それ自体でチャート上に配置され、バックグラウンドで動作して、選択したペアと時間枠でアラートを送信するように設計されています。多くの人々が1つのMT4の複数のチャートで市場反転インジケーターを実行するのではなく、一度に複数のペアと時間枠を監視するためにダッシュを要求した後に開発されました。 M5、M15、M30、H1、H4、およびD1の時間枠でアラートを出します。もちろん、取引の場合と同様に、より高い時間枠が最も効果的です。 このダッシュボードは、市場構造反転インジケーターのアドオンとして設計されています。それは独立して機能し、マーケットリバーサルアラートインジケーターによって与えられたパターンと信号にアラートを出します。 ここでマーケットリバーサルアラートインジケーターを取得します:https:// www.mql5.com/en/market/produ
PZ Day Trading
PZ TRADING SLU
3.67 (3)
このインディケータは、価格アクション分析とドンチャンチャネルのみを使用して、ジグザグ方式で価格の反転を検出します。再描画やバックペインティングを一切行わずに、短期取引向けに特別に設計されています。それは彼らの操作のタイミングを増やすことを目指している賢明なトレーダーにとって素晴らしいツールです。 [ インストールガイド | 更新ガイド | トラブルシューティング | よくある質問 | すべての製品 ] 驚くほど簡単に取引できます すべての時間枠で価値を提供します 自己分析統計を実装します 電子メール/音声/視覚アラートを実装します 可変長のブレイクアウトと混雑ゾーンに基づいて、インディケータは価格アクションのみを使用して取引を選択し、市場が非常に高速に行っていることに反応します。 過去のシグナルの潜在的な利益が表示されます この指標は、独自の品質とパフォーマンスを分析します 負けブレイクアウトは強調表示され、説明されます インジケータは、非バックペインティングおよび非再ペイントです この指標は、日中のトレーダーが単一の価格反転を見逃さないようにするのに役立ちます。ただし、す
M1 Arrow
Oleg Rodin
4.73 (15)
市場の2つの基本原則に基づく日中戦略。 このアルゴリズムは、追加のフィルターを使用したボリュームと価格の波の分析に基づいています。インディケータのインテリジェントアルゴリズムは、2つの市場要因が1つに結合した場合にのみシグナルを出します。インディケータは、より高い時間枠のデータを使用して、M1チャート上の特定の範囲の波を計算します。そして波を確認するために、インジケーターはボリュームによる分析を使用します。 このインディケータはレディトレーディングシステムです。トレーダーが必要とするのは、信号に従うことだけです。また、インジケーターはあなた自身の取引システムの基礎になることができます。取引はミニッツチャートでのみ行われます。 インジケーターがMTFの原則を使用しているという事実にもかかわらず、インジケーターのアルゴリズムは可能な限り安定しています。 購入後、必ず私に書いてください!私の取引設定と推奨事項をあなたと共有します!
作者のその他のプロダクト
Scalping indicator. It takes into account volatility, price movement in the local interval and the direction of the current trend. Recommended timeframe - M5. Advantages: Low volatility when a signal appears ensures minimal movement against an open position. The indicator does not redraw its signals. There are alert signals. It is a great tool for day trading. Settings: Name Description Period Indicator period Range of each bar in the period (pp.) The maximum size of each candle in the indicat
FREE
.See screenshots of the indicator. Uses information about the current trend. It is based on the classic ADX indicator. Gives a signal to enter a trade using a non-standard strategy. Settings: Name Description Period of ADX The period of the classic ADX indicator Distance between +D & -D lines Distance between + D and -D lines . Determines the strength of the trend. Freshness of the signal (bars) Checking the freshness of a buy or sell signal. Selects the very first signal in the span. The nu
FREE
The indicator gives buy or sell signals based on the Parabolic SAR indicator, and it also contains strategies with Moving Average. There are alerts and alerts to the mobile terminal and to the mail. Arrows are drawn on the chart after the signal is confirmed. They don't redraw. I recommend watching my advisor -   Night Zen EA To keep up to date with my latest products and ideas, join my telegram channel and subscribe to my profile. The link in my profile contacts - My profile   The indicator i
FREE
The indicator has combined 5 popular strategies. Draws an arrow after confirming a signal for the selected strategy. There are signal alerts. Doesn't redraw its values. I recommend watching my advisor -   Night Zen EA 5 strategies. The main line crosses the signal line. The main line crosses the signal line in the oversold (for buy) / overbought (for sell) zones. The main line enters the oversold (for sell) / overbought (for buy) zones . The main line comes out of the oversold (for buy ) / ove
FREE
Looking for entry points along the local trend without repaint! Arrows indicate entry points. Based on classic indicators. The indicator is easy to use. Settings Наименование Описание Frequency factor Signal frequency. The less, the more often. This affects the quality. Recommendations Recommended for use on major currency pairs. Timeframe from m5, m15, m30 Subscribe to my telegram channel, where we discuss intraday trading, ideas, indicators, etc., a link in my profile contacts.
FREE
Advantages: Based on classic indicators - ATR, Moving Average Determines the trend / flat in the market by coloring the histogram with the appropriate color Arrows indicate confirmed signals It is an excellent filter for channel strategies (by extremes) Settings: Наименование Описание настройки Period of Flat Detector Number of bars / candles for analysis Period of EMA Period of EMA (Moving Average) Period of ATR Period of ATR (current timeframe) Coefficient of deviation Coefficient of devia
FREE
The indicator is completely based on the classic MFI indicator. I recommend watching my advisor -   Night Zen EA It contains two basic trading strategies: The output of the MFI line from overbought/oversold zones. The entry of the MFI line into the overbought/oversold zones. Arrows are drawn after confirming the signal by strategies and are not redrawn. Alerts are also registered: Alerts Push notifications to the mobile terminal email Settings: MFI period - the period of the MFI indicator L
FREE
The indicator is based on the Stochastic indicator. I also recommend to see my EA   Night Zen Strategy: It contains a strategy for crossing the K and D lines in the overbought (for sales) and oversold (for purchases) zones. The indicator gives a signal at the second intersection. The signals are not rewritten, they appear after confirming the intersection of the K and D lines. Settings: Stochastic Indicator Settings Indicator period Notification and Alert Settings
FREE
The indicator is based on the classic CCI indicator. I recommend watching my advisor -   Night Zen EA Doesn't redraw its signals. There are alerts for the incoming signal. It contains 2 strategies: Entry of the CCI line into the overbought zone (for buy trades ) / into the oversold zone (for sell trades ) Exit of the CCI line from the overbought area (for sell trades) / from the oversold area (for buy trades) Settings: Name Setting Description Period Period of the classic CCI indicator Price C
FREE
Defines extremes. This indicator consists of two parts. The first draws lines on the chart indicating low volatility in relative daily market activity. The second is responsible for determining the extremum and gives signals to buy or sell. This system is suitable for all instruments. It is recommended to use a timeframe from m15 to h4. Before using, you need to choose the settings for yourself. Configure lines deviation. Specify volatility coefficient. Advantages The indicator does not repaint
FREE
The indicator is designed for fast scalping. The principle of operation of the indicator is based on the direction of the Moving Average. The period and sensitivity of the Moving Average can be adjusted for yourself in the indicator settings. I recommend watching my advisor -   Night Zen EA Subscribe to my telegram channel, link in my profile contacts. Advantages of the indicator: The free version is full, there are no additional purchases The arrows are not redrawn, the signal comes after
FREE
This is the author's trading system. Designed for intraday trading. Signals are not rewritten. Suitable for any instrument and timeframe. You can enable alerts. Easy to use. See screenshots. Simple settings! Everything has already been done for you! The basis is the analysis of the current trend. The indicator is looking for a way out of accumulation. If you have been looking for a good trading system for a long time, then it is in front of you! Subscribe to my telegram channel, where we discu
FREE
Monitors the current trend, gives signals for an uptrend, downtrend and weakening of the current trend. Colors the situation on the market with the appropriate color. Tool - any. Timeframe - any. Advantages The indicator does not repaint its signals. There are alert signals. Easy to use. Flexible settings. Suitable for trading any financial instruments. Settings Name Description Fast parameter The value of the fast parameter in the indicator (Should be less than the slow one). Slow parameter The
FREE
+ 2 bonus strategies! Alerts! I recommend watching my advisor -   Night Zen EA The indicator combines the most popular moving average strategies: Simple moving average crossover. Moving average crossover relative to the position of the slower moving average. 2 bonus strategies : The crossing of the fast moving average with the calculation of the opening prices of the slow moving average with the calculation of the closing prices taking into account the slower moving average. (The settings for th
FREE
The indicator is designed for intraday trading. Equipped with all notification functions for convenience in manual trading. It is recommended to use timeframes m5, m15, m30. You can also view and select settings for any financial instrument. Settings: Indicator period - Indicator period Alert - The function of enabling alerts. Push notifications - Enabling Push notifications to the mobile terminal e-mail - Sending a signal to e-mail In addition to this product, I recommend looking at my o
FREE
The indicator displays signals on the chart of the classic RVI indicator with an alert. The indicator signals after confirmation of the strategy at the opening of a new bar. I recommend watching my advisor -   Night Zen EA In the settings, you can select the following strategies: The main line crosses the signal line The main line crosses the zero level In the settings, you can change the period of the classic RVI indicator. I also recommend to look at my other developments in the market:
FREE
3 strategies with RSI! Alerts! Signal freshness check! The indicator is based on the classic RSI. I recommend watching my advisor -   Night Zen EA It includes 3 strategies: Entry of the RSI indicator into the overbought zone (for buy trades) / oversold (for sell trades) Exit of the RSI indicator from the overbought zone   (for sell trades) / oversold (for buy trades) Touching the overbought limit (for sell trades) / oversold (for buy trades) The indicator provides alerts. To enable them in the s
FREE
The indicator shows the current situation on 16 indicators and 10 strategies. Its values are formed based on the evaluation of the specified criteria for each strategy separately. As a result, we can observe on the chart the strength of all the indicators included in it, as well as additional logic. Advantages: Signals do not redraw their values. The arrow is drawn after confirmation. All types of alerts. Shows weak zones based on the evaluation results. The passing value of the score is de
FREE
Multicurrency EA . Uses Stop-Loss and Take-Profit. Trades from local levels. There are restrictions on trading - by the level of drawdown, slippage and spread. Risk management. With each unsuccessful trade, the robot increases the lot in order to cover the loss from the previous Stop-Loss and profit from the past potential Take-Profit. After the first unsuccessful trade, the robot opens another one in the same direction. If the number of unsuccessful trades in a row is more than 2, the robot l
A multi-currency scalping robot at night. In the second version, only EURCHF is traded. Signal version 1.0 (Multiplier = 1) Night Zen - the night scalper uses low-volatility areas on the chart to search for a potential price reversal. The Expert Advisor enters the market with only one transaction if all conditions are met. To protect trades, the EA sets a fixed Stop Loss. The adviser can close a deal both on Take Profit and on the strategy embedded in it. The Expert Advisor trades on the m15 tim
Multicurrency indicator in table format. Signals appear with confirmation, no repaints. Works on the current (open) timeframe. Notifications come for an open instrument. In the indicator settings, you can choose 1 of 4 Moving Average strategies. Strategies (represented in screenshots): Classic fast and slow moving average crossover Reverse signal of classic crossing (used for flat/sideways movement) Classic crossover relative to a slower moving average (Trend MA in settings) Price touching the f
Multicurrency indicator in table format. Signals appear with confirmation, no repaints. In the settings, you can select the number of candles/bars on which the signal will still be displayed so that the trader takes it into account and does not miss it. The indicator works on the current (open) timeframe. Notifications come for an open instrument. In the indicator settings, you can choose 1 of 4 Stochastic strategies Strategies (represented in screenshots): The main line crosses the signal line
Multicurrency indicator in table format. Signals appear with confirmation, do not redraw. The indicator works on the current (open) timeframe. Notifications come for an open instrument. The strategy includes: price touching the moving average in the direction of the trend, as well as an extraordinary recalculation of the classic ADX indicator to determine the trend as an additional filtering of entries. Entries are displayed on the chart as arrows and, as mentioned above, the arrows are not redr
Multicurrency indicator in table format. Signals appear with confirmation, no repaints. Works on the current (open) timeframe. Notifications come for an open instrument. In the indicator settings, you can choose 1 of 4 Moving Average strategies. Strategies (represented in screenshots): Classic fast and slow moving average crossover Reverse signal of classic crossing (used for flat/sideways movement) Classic crossover relative to a slower moving average (Trend MA in settings) Price touching the f
フィルタ:
Trader mql5
1265
Trader mql5 2023.06.28 02:31 
 

This (as all the other indicators by you) is absolutely superb. Arrows do not redraw and show on start of new candle, not to confuse the user that the signal has occured during the previous candle. Well programmed with enough parameters to suit. If you can just configure the arrow to be located by users choice, that would make it perfect. The indicators are free for now, but these indicators are so good that I hope they get popular and seller can charge. I use it to confirm the price action that I see, I use all your indicators the same. One needs to understand MACD a little bit to make it useful, but thank you very much.

Niesler Fabrício
42
Niesler Fabrício 2022.09.12 16:42 
 

Excelente indicador. Me ajudou muito. Já pensou em combinar com outros? estou fazendo alguns teste bem interessantes. Um abraço.

ThorstenKock
2584
ThorstenKock 2022.04.11 22:25 
 

ユーザーは評価に対して何もコメントを残しませんでした

Anton Iudakov
16175
開発者からの返信 Anton Iudakov 2022.04.11 22:39
Lol. It's not the first time you've left an incompetent review. You know absolutely nothing about trading. I advise you not to do trading, you will save your money. This indicator interprets the data of the classic MACD indicator and does not give accurate buy or sell signals. But you can also use flexible settings for this. Or maybe everything is much simpler, and you are offended by life judging by the description of your profile.
PAVEL KARAKULOV
427
PAVEL KARAKULOV 2022.04.10 19:34 
 

ユーザーは評価に対して何もコメントを残しませんでした

Anton Iudakov
16175
開発者からの返信 Anton Iudakov 2022.04.10 21:36
The strategy for determining the weakness of the trend is in the default settings. It remains only to change the level of divergence, this is indicated in the points
レビューに返信