Moving Average Dashboard MT4
- インディケータ
- Mike Pascal Plavonil
- バージョン: 1.0
- アクティベーション: 5
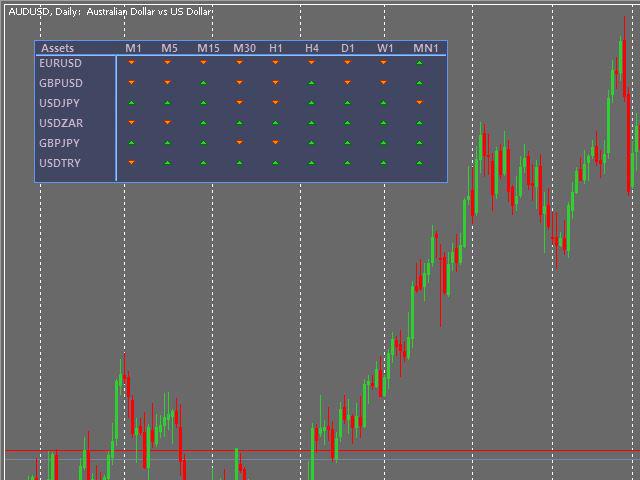
The Moving Average Dashboard indicator allows you to see the relationship between a fast and a slow moving average.
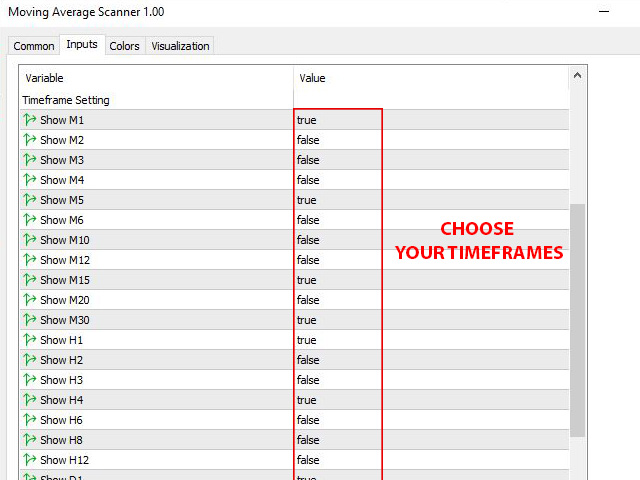
This indicator is working on multiple symbols and up to 21 timeframes.
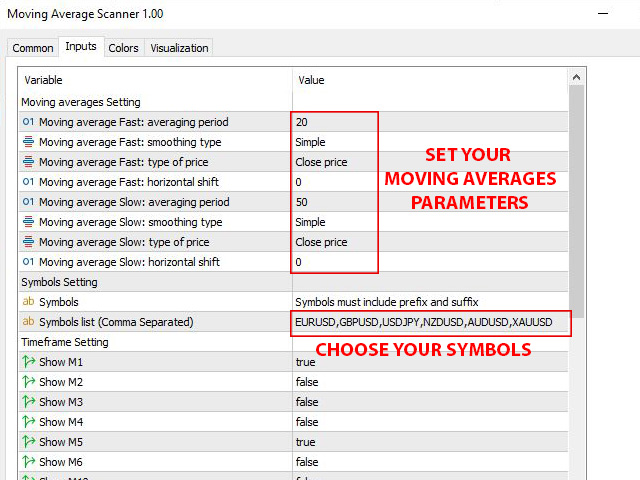
It's allows you to configure the fast and slow moving averages to whatever period, method or price is appropriate
The Moving Average Dashboard saves you time as you can use the indicator to scan multiple currency pairs or other symbols in just one window.
Installation
Download the Indicator in your MT5 terminal after you have purchased the product.
Place the indicator on one chart in your MT5 terminal (it does not matter what chart is used, any symbol and time frame can be used), and from that moment the indicator will load the data for all timeframes as you have configured.
Contact
If you have some questions or if you need help, contact me via Private Message.