KF Bollinger Bands MT5
- インディケータ
- Sevgi Hilal Kilic
- バージョン: 1.0
- アクティベーション: 10
KF-BB
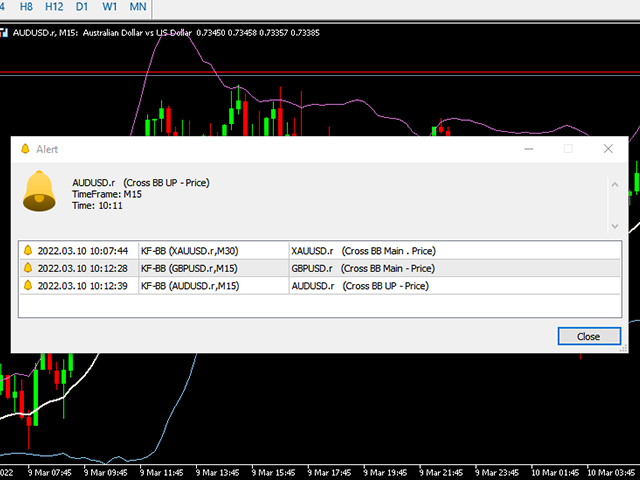
Show alert in Meta Trade
Send notification to mobile
Adjustable Exponentıal
Can be used on all symbols
Can be used in all time frames
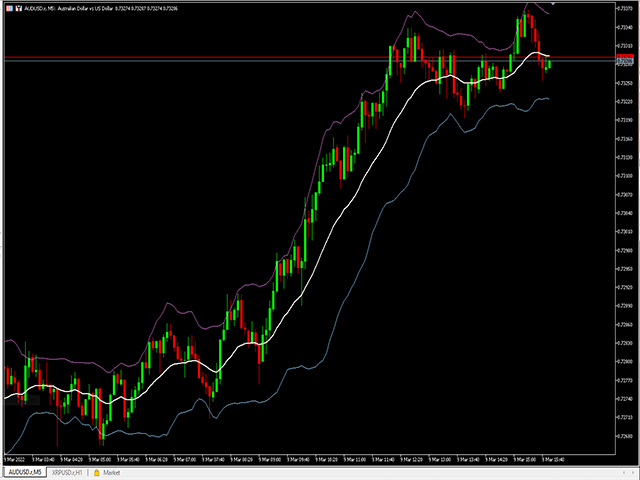
Professional Bollinger Bands with Alert.
Bollinger bands available in the market are mostly drawn based on simple moving average . KF-BB is the first bollinger bands that can draw the center line using all the usual methods simple , exponential, etc. A very professional indicator, it does not end here other advantages of this indicator include creating an alarm on the desktop and the mobile phone When the candlesticks hit one of the center lines or the upper and lower bands
Show alert in Meta Trade
Send notification to mobile
Adjustable Exponentıal
Can be used on all symbols
Can be used in all time frames
Attention, the application does not work in the strategy tester |
|---|
You can download the Demo version on the comments page : https://www.mql5.com/en/market/product/81152?source=Site |