Tick StdDev
- インディケータ
- Andrej Nikitin
- バージョン: 1.12
- アップデート済み: 18 11月 2021
- アクティベーション: 5
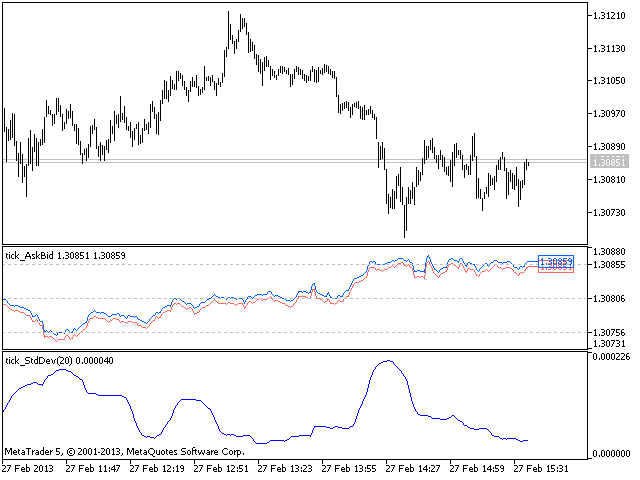
The Standard Deviation (StdDev) indicator drawn using a tick chart.
After launching it, wait for enough ticks to come.
Parameters:- Period - period of averaging.
- Method - method of averaging.
- calculated bar - number of bars for the indicator calculation.