ABCD Pattern Scanner
- インディケータ
- Reza Aghajanpour
- バージョン: 1.25
- アップデート済み: 5 2月 2023
- アクティベーション: 20
** All Symbols x All Timeframes scan just by pressing scanner button **
***Contact me after the purchase to send you instructions and add you in "ABCD scanner group" for sharing or seeing experiences with other users.
Introduction
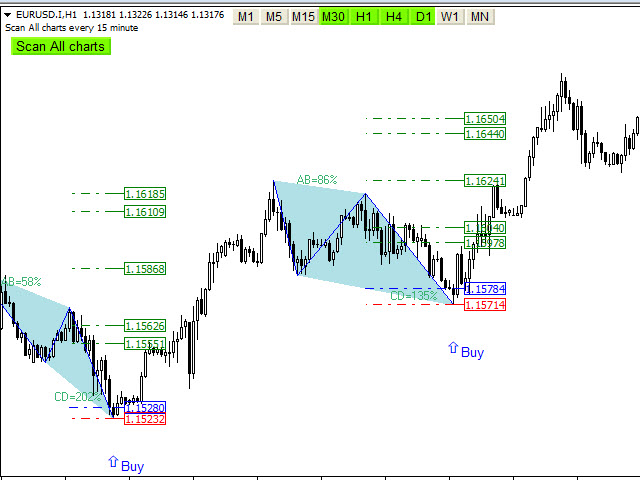
This indicator scans AB=CD retracement patterns in all charts. The ABCD is the basic foundation for all harmonic patterns and highly repetitive with a high success rate.
The ABCD Scanner indicator is a scanner reversal ABCD pattern that helps you identify when the price is about to change direction. The idea is that you can buy when prices are low and sell when they are high. This indicator is easy to use with stop loss, entry point and take profits level. Entry point is based on checking candlestick pattern.
Main Features
- Detect the best and most successful patterns : AB=CD, Perfect ABCD
- Easy-to-use and user-friendly indicator
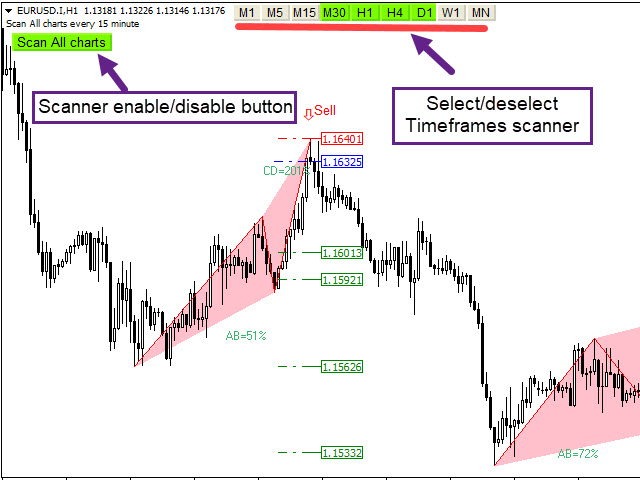
- Scan all charts button ( Forex, Crypto, Indices and commodities)
- Select and deselect time frames button for scan (M5,M15,M30,H1,H4,D1,W1,MN)
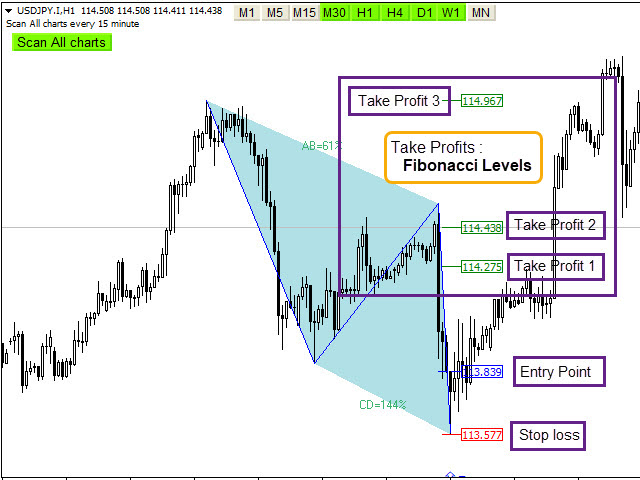
- It displays and pushes notification stop-loss, entry-point and take-profit levels
- Candlestick check for the best entry point
- Method to choose how appearing pattern : breakout(after breakout) or pattern(in leg 4)
- Use Fibonacci levels
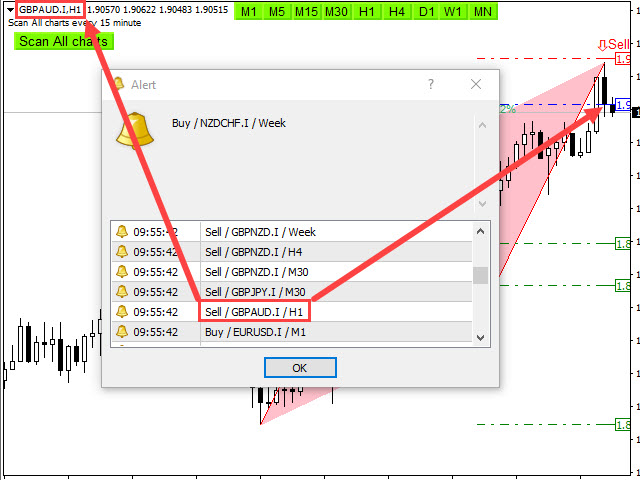
- Sending the alert and push notification
- Alert enable/disable base on your setting time
- Adjust the pattern setting
- Scan All Charts – Scan all chart and all time frames
- Scan the number of candles – Amount of history bars to evaluate
- Re-scan Timer – Re-scan all chart and all time frames after passing time
- Method - choose how appearing a pattern : breakout(after breakout) or pattern(in leg 4 )
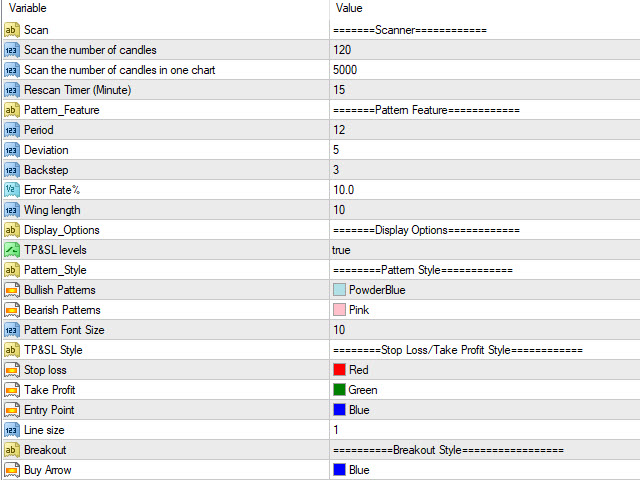
- Pattern Feature(Period, Deviation, Back step) - Algorithm Parameters for pattern recognition
- Error Rate – Maximum allowable error relative to pattern percentage
- Wing length - Minimum distance between two legs in a pattern
- Display Options – Display or do not display Percentage Lines, TP&SL levels
- Pattern, Percentage Line, Stop Loss/Take Profit levels and Breakout Style - Set the Fonts and colors of patterns
- Display Alert or Push Notification – Enable or disable Alert or Push Notification
- How many candles are past a pattern – Maximum Number of candles Passed from a pattern to allow alert
- Alert Buffer Size – Maximum save alert to prevent duplicate alerts
- Alert start/end time – Determine trading hours based on the computer clock to activate and deactivate the alarm
Input Parameters
=========Scanner============
=======Pattern Feature============
=======Display/style Options============
========ALERT SETTINGS ==========
C Point Retracement BC Projection
0.382 2.618
0.50 2.0
0.618 1.618
0.707 1.41
0.786 1.27
0.886 1.13


Thank you for this indicator.