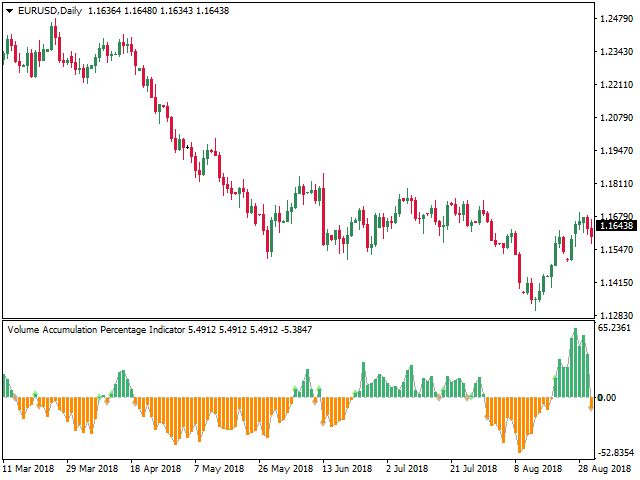
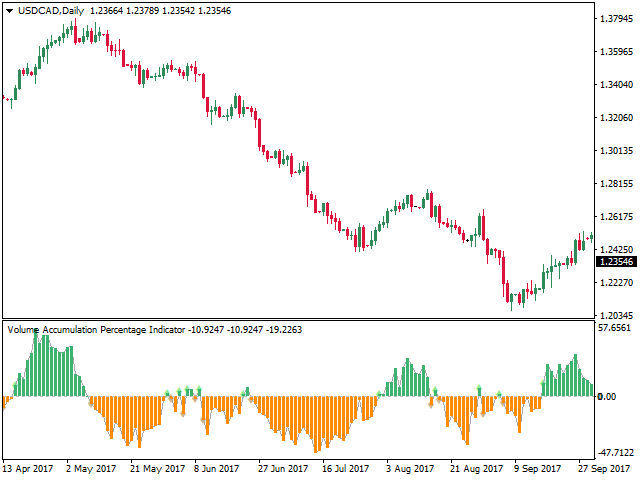
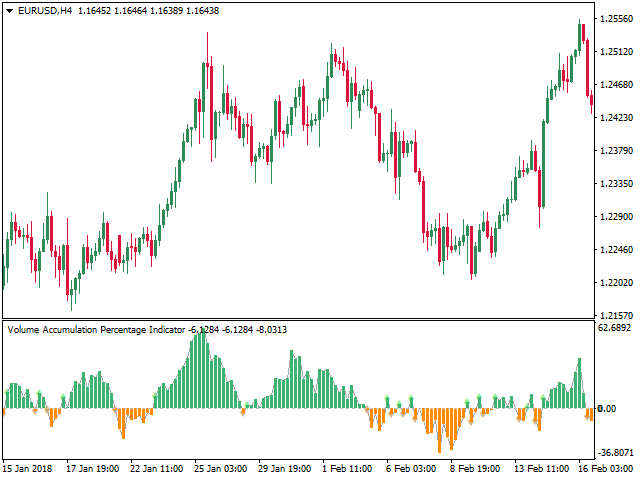
Volume Accumulation Trend
- インディケータ
- Libertas LLC
- バージョン: 1.0
- アクティベーション: 20
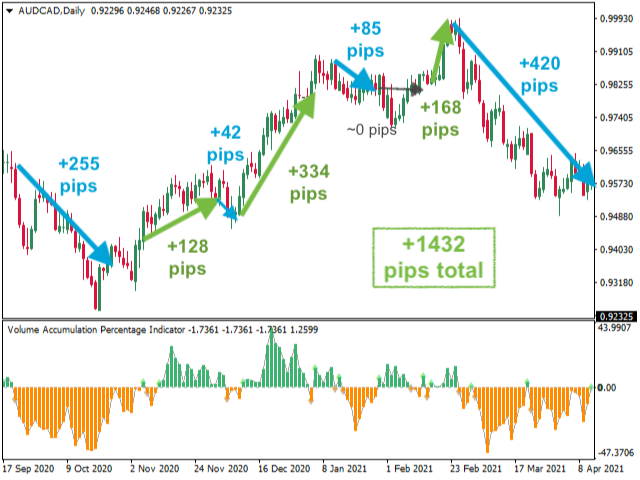
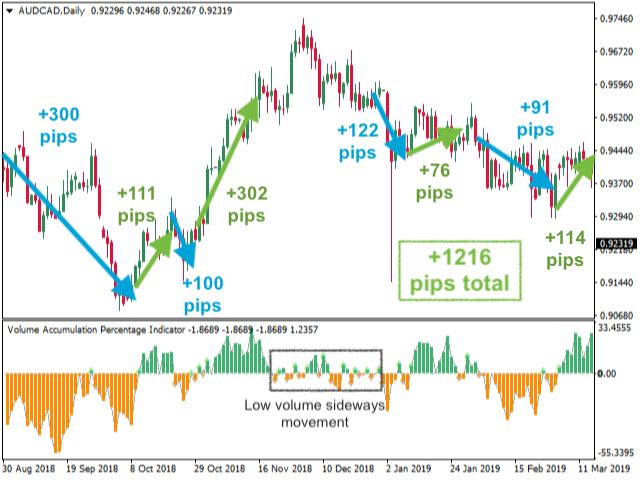
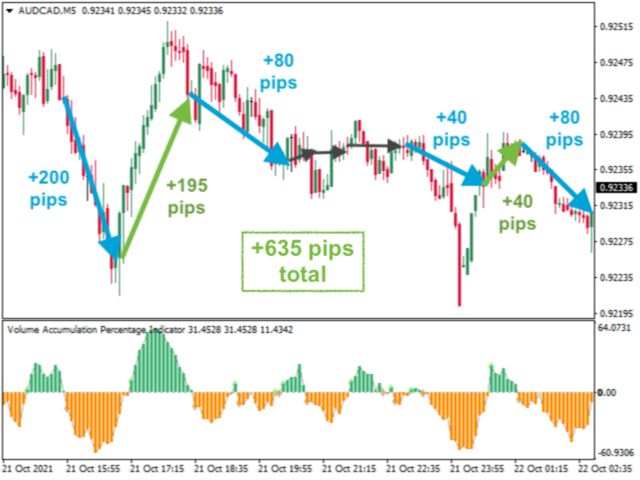
Looking for strong trend entrance and exit points of trends? This incorporates volume into price calculations for a fast entry/exit, showing how supply and demand factors are influencing price, and giving you more insights than the average trader uses.
The Volume Accumulation Trend indicator is a cumulative indicator that uses both volume and price to investigate whether an asset is growing or falling. It identifies differences between the price and the volume flow, which lets us know how strong a trend is. This lets traders profitably exit trends before the obvious price action signals that everyone else is watching for, giving a leg up over most traders.
- e.g., although the price is rising, volume may begin to decrease behind-the-scenes, indicating that the trend may be getting to an end and reversing. Generally, entering and exiting at this point gives much better timings.
How to Use
- Enter long position when the indicator first turns green (and exit any short positions)
- Enter short position when the indicator first turns red (and exit any long positions)
This indicator will occasionally alert for quick entrance/exits, particularly when oscillating in sideways markets. This can be a pain, and may be avoided by not trading in sideways directional markets (check out our True Choppiness Direction or Choppiness Index to help with this). Overall it's worth it though, because this indicator tends to be very good at giving timely entrance and exit points to capture big price movements, and then get you out to take profits at the right time. Try the free demo, and see what we mean!
Alerts
Message, sound, and email alerts can be activated when the trend moves upward or downward. Dot indicators can be turned on/off and recolored in Parameters.
Parameters
- Time Periods: # intervals to use to calculate indicator
- Smoothing Periods: # intervals to use to show smoothed EMA of indicator (included as an option for specific trading styles)
- Turn on alerts message: If true, turns on message box alerts (when indicator line crosses control)
- Turn on alerts sound: If true, turns on alerts sound (when indicator line crosses control)
- Turn on alerts email: If true, turns on alerts email (when indicator line crosses control)
- Wait on new candle opening: If true, waits to trigger alert until the opening of the next candle (so that if a current candle dips quickly but recovers, it will prevent a false positive). We tend not to use this, and prefer a faster entry point, but it depends on your trading style!
- Colors: Options to specify custom colors for different components of the indicator (indicator line, control line, dots, etc)
- Show lines/dots: Options to show or hide dot or line elements of the indicator
iCustom
You can integrate this indicator into your EA! After downloading, developers can use the following code to incorporate this:
iCustom(NULL,0,"Volume Accumulation Percentage Indicator",10, 10, false, false, false, false, false, false, clrGray, clrGray, clrGray, clrGray, clrGray, 0, 0); // VAP alerts for upward crossing (EMPTY_VALUE or not empty)
iCustom(NULL,0,"Volume Accumulation Percentage Indicator",10, 10, false, false, false, false, false, false, clrGray, clrGray, clrGray, clrGray, clrGray, 1, 0); // VAP alerts for downward crossing (EMPTY_VALUE or not empty)
iCustom(NULL,0,"Volume Accumulation Percentage Indicator",10, 10, false, false, false, false, false, false, clrGray, clrGray, clrGray, clrGray, clrGray, 2, 0); // VAP indicator value