• 概要
  • レビュー
  • コメント

Inside Bars MTF

Price breakouts, Levels, Multi-time frame

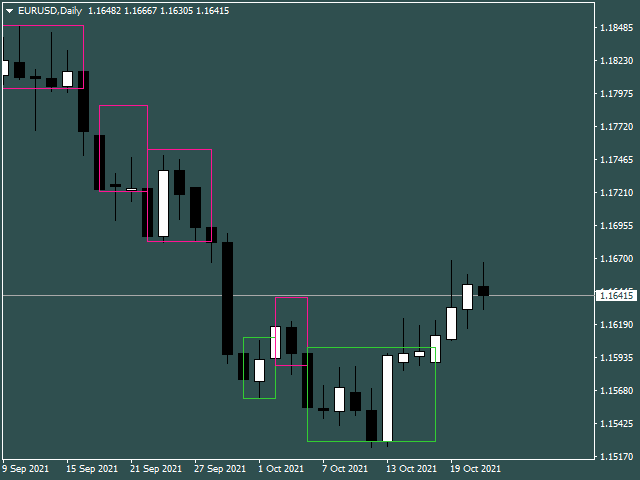
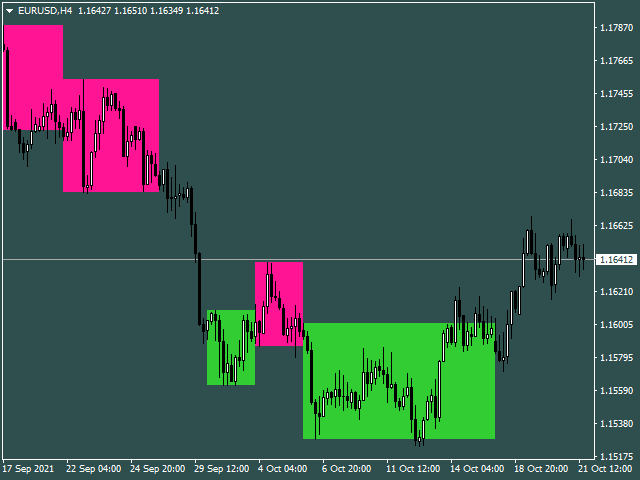
Inside bars checks for price failure to break from the previous high/low and on breakout draws a breakout box on the chart. The choice of breakout price is given to the user i.e. close or high/low of bar. Alerts can be received on breakouts.

Features:-

  • Multi-time frame
  • Alerts, notifications & emails

Usage:-

  • Breakout signals
  • Check how price action is evolving with the help of boxes
  • Get multi-time frame bias
おすすめのプロダクト
Free automatic Fibonacci is an indicator that automatically plots a Fibonacci retracement based on the number of bars you select on the BarsToScan setting in the indicator. The Fibonacci is automatically updated in real time as new highest and lowest values appears amongst the selected bars. You can select which level values to be displayed in the indicator settings. You can also select the color of the levels thus enabling the trader to be able to attach the indicator several times with differe
FREE
Multi Divergence Indicator for MT4 - User Guide Introduction Overview of the Multi Divergence Indicator and its capabilities in identifying divergences across multiple indicators. Importance of divergence detection in enhancing trading strategies and decision-making. List of Indicators RSI CCI MACD STOCHASTIC AWSOME MFI ACCELERATOR OSMA MOMENTUM WPR( Williams %R) RVI Indicator Features Indicator Selection: How to enable/disable specific indicators (RSI, CCI, MACD, etc.) for divergence detection.
FREE
Suitable for Beginners and Satisfying for Experienced Traders Are you an experienced trader? I don't have to explain anything to you. You know what a reliable backtest and a long time in the market are worth. Have fun with all the informations at your disposal. Are you a beginner? You don't have to worry about setting any operational parameters or doing a lot of backtesting to find the ideal setting. Just look at the statistics and assess the risk you want to take. Do a backtest to ensure the
FREE
Trend arrow Indicator is an arrow Indicator used as an assistant tool for your trading strategy. The indicator analyzes the standard deviation of bar close for a given period and generates a buy or sell signals if the deviation increases. It good to combo with Martingale EA to follow Trend and Sellect Buy Only/Sell Only for EA work Semi-Automatic. You can use this  Indicator with any EAs in my Products.
FREE
トレンドキャッチャー: アラートインジケーター付きのトレンドキャッチャーストラテジーは、市場トレンドやポテンシャルなエントリーポイントやエグジットポイントを特定するのに役立つ多目的な技術分析ツールです。動的なトレンドキャッチャーストラテジーを備えており、市場状況に適応してトレンドの方向を明確に視覚化します。トレーダーは、自身の好みやリスク許容度に合わせてパラメーターをカスタマイズできます。このインジケーターはトレンドの識別を支援し、ポテンシャルなリバーサルをシグナルし、トレイリングストップのメカニズムとして機能し、市場への迅速な対応のためのリアルタイムアラートを提供します。 特徴: - トレンドの識別:上昇トレンドと下降トレンドをシグナルします。 - トレンドのリバーサル:ローソク足の色が上昇から下降に変わった場合やその逆の場合に、ポテンシャルなリバーサルを警告します。 - リアルタイムアラート:新しいトレンドの識別に対するアラートを生成します。 推奨事項: - 通貨ペア:EURUSD、AUDUSD、XAUUSDなど... - タイムフレーム:H1。 - アカウン
FREE
Discover the power of precision and efficiency in your trading with the " Super Auto Fibonacci " MT4 indicator. This cutting-edge tool is meticulously designed to enhance your technical analysis, providing you with invaluable insights to make informed trading decisions. Key Features: Automated Fibonacci Analysis: Say goodbye to the hassle of manual Fibonacci retracement and extension drawing. "Super Auto Fibonacci" instantly identifies and plots Fibonacci levels on your MT4 chart, saving you tim
FREE
A visual tool to assist in trading and analysing bolinger bands.  Arrows are not to be used for entry but rather assist in developing potential bias. Repaints in lower timeframes. Predicts if price will be higher or lower than the signal candle. Perfect for mean reversion trading, binary options or futures contracts on larger time frames. The indicator was backtested on 5 years of data and has a 90% accuracy for predicting price reversals over time.
FREE
Fibonacci SR Indicator This indicator creates support and resistance lines. This indicator is based on Fibonacci Retracement and Extension levels. It will consider many combinations of the Fibonacci levels and draw support/resistance lines based on these. This indicator uses tops and bottoms drawn by the ZigZag indicator in its calculations. The ZigZag can also be drawn on the chart, if necessary. The indicator considers many combinations of past reversal points and Fibonacci ratio levels, and
FREE
Triple RSI
Pablo Leonardo Spata
2.5 (2)
LOOK AT THE FOLLOWING STRATEGY   WITH THIS INDICATOR.   Triple RSI   is a tool that uses the classic Relative Strength Indicator, but in several timeframes to find market reversals.    1.  ️ Idea behind the indicator and its strategy: In Trading, be it Forex or any other asset, the ideal is   to keep it simple, the simpler the better . The   triple RSI   strategy is one of the simple strategies that seek market returns. In our experience, where there is more money to always be won, i
FREE
KT Fractal Channel Breakout draws a continuous channel by connecting the successive Up and Down fractals. It provides alerts and also plots the Up and Down arrows representing the bullish and bearish breakout of the fractal channel. Features If you use Bill Williams fractals in your technical analysis, you must also include it in your trading arsenal. It can be very effective and useful for stop-loss trailing. A new market trend often emerges after a fractal channel breakout in a new directi
TrendPlus
Sivakumar Subbaiya
4.21 (14)
Trend Plus   Trendplus  Indicator   Time Frame: Suitable for any time frame.  Purpose: Trend Prediction. Blue and red candle indicate the buy and sell call respectively. Buy: When the blue candle is formed buy call is initiated. close the buy trades when the next red candle will formed.   Sell: When the Red candle is formed Sell call is initiated. close the Sell trades when the next blue candle will formed.   Happy trade!!
FREE
YOU CAN NOW DOWNLOAD FREE VERSIONS OF OUR PAID INDICATORS . IT'S OUR WAY OF GIVING BACK TO THE COMMUNITY ! >>>    GO HERE TO DOWNLOAD   The system is a free open source pine script originally published on TradingView by everget   . It was converted to Mt4 by Forex Robot Makers. This system is a  popular trend indicator based on ATR ( Average True Range ) , Moving Averages and the Donchian channel . System BackGround ATR The average true range is an indicator of the price volatility of an as
FREE
QuantumAlert Stoch Navigator is a free indicator available for MT4/MT5 platforms, its work is to provide "alerts" when the market is inside "overbought and oversold" regions in the form of "buy or sell" signals. This indicator comes with many customization options mentioned in the parameter section below, user can customise these parameters as needful. Join our   MQL5 group , where we share important news and updates. You are also welcome to join our private channel as well, contact me for the p
FREE
Two Period RSI compares long-term and short-term RSI lines, and plots a fill between them for improved visualization. Fill is colored differently according to an uptrend (short period RSI above long period RSI) or a downtrend (short period RSI below long period RSI). Short-term RSI crossing long-term RSI adds a more robust trend confirmation signal than using single period RSI alone. This is a small tool to help visualize and confirm RSI trends. We hope you enjoy! Looking for RSI alerts? You can
FREE
PZ Trendlines
PZ TRADING SLU
4.64 (11)
Tired of plotting trendlines? The PZ TrendLines indicator applies a mechanical approach to the construction of trend lines for you!  [ Installation Guide | Update Guide | Troubleshooting | FAQ | All Products ] It can draw up to 18 trendlines Trendlines can be optionally based on fractals Each line represents a breakout level Each trendline can be broken or rejected Configurable amount of lines Configurable colors Support I am happy to provide free products but given my limited time, they come
FREE
Are you tired of drawing trendlines every time you're analyzing charts? Or perhaps you would like more consistency in your technical analysis. Then this is for you. This indicator will draw trend lines automatically when dropped on a chart. How it works Works similar to standard deviation channel found on mt4 and mt5. It has 2 parameters: 1. Starting Bar 2. Number of bars for calculation The   starting bar   is the bar which drawing of the trend lines will begin, while the   number of bars for c
FREE
ピボットポイントフィボRSJは、フィボナッチレートを使用してその日のサポートラインとレジスタンスラインを追跡するインジケーターです。 この壮大な指標は、フィボナッチレートを使用してピボットポイントを通じて最大7レベルのサポートとレジスタンスを作成します。 価格がこのサポートとレジスタンスの各レベルを尊重する方法は素晴らしいです。そこでは、オペレーションの可能な入口/出口ポイントを認識することができます。 特徴 最大7レベルのサポートと7レベルの抵抗 レベルの色を個別に設定します 入力 ピボットタイプ ピボットフィボRSJ1 =フィボ比1の計算 ピボットフィボRSJ2 =フィボ比2の計算 ピボットフィボRSJ3 =フィボ比3の計算 ピボットフィボクラシック=クラシックピボット計算 最小ピボットレベル ピボット3レベル ピボット4レベル ピボット5レベル ピボット6レベル ピボット7レベル それでも質問がある場合は、ダイレクトメッセージで私に連絡してください: https://www.mql5.com/ja/users/robsjunqueira/
FREE
This indicator scans for you up to 30 trading instruments and up to 8 timeframes for occurrences of the high probability reversal patterns: Double Tops/Bottoms with fake breakouts . Please read also the blog post " Professional Trading With Double Tops/Bottoms And Divergences! " which explains the concepts behind the ULTIMATE Double Top/Bottom indicator and how you can use a professional top-down approach. This FREE Version of the Scanner scans only EURUSD and GBPUSD. The full version of the sca
FREE
The ADX Indicator is known to be used to determine the trend direction. Not only that, but it also has deviation (+DI and -DI) that determine the direction of the trend as well. The role of the indicator is to spot the trend and its direction and generate signals accordingly. Indicator Settings: - ADX period : default is 14 periods (it works best with the timeframe H1). - Signal Width : the size of signals arrows. - Signal Distance : the distance of the signal arrow from the candle. - Signal c
FREE
Necessary for traders: tools and indicators Waves automatically calculate indicators, channel trend trading Perfect trend-wave automatic calculation channel calculation , MT4 Perfect trend-wave automatic calculation channel calculation , MT5 Local Trading copying Easy And Fast Copy , MT4 Easy And Fast Copy , MT5 Local Trading copying For DEMO Easy And Fast Copy , MT4 DEMO Easy And Fast Copy , MT5 DEMO Fibo: from KTrade 1. Automatically calculate and analyze the band. -> Get the desired band 2.
FREE
Necessary for traders: tools and indicators Waves automatically calculate indicators, channel trend trading Perfect trend-wave automatic calculation channel calculation , MT4 Perfect trend-wave automatic calculation channel calculation , MT5 Local Trading copying Easy And Fast Copy , MT4 Easy And Fast Copy , MT5 Local Trading copying For DEMO Easy And Fast Copy , MT4 DEMO Easy And Fast Copy , MT5 DEMO Can set the cycle for other varieties of K line graph covered this window, fluctuations obse
FREE
Vanda FX
Sayan Vandenhout
5 (2)
Vanda FX USES THE TREND WAVE INDICATOR AND IT CAN IDENTIFY THE BEGINNING AND THE END OF A NEW WAVE TREND MOVEMENT. AS AN OSCILLATOR, THE INDICATOR IDENTIFIES THE OVERBOUGHT AND OVERSOLD ZONES. IT WORKS GREAT TO CATCH THE SHORT TERM PRICE REVERSALS AND USES A MARTINGALE STRATEGY TO CLOSE ALL TRADES IN PROFIT. USE DEFAULT SETTINGS ON H1 OR HIGHER TIME FRAME ON ANY PAIR FOR MORE ACCURATE TRADES WHY THIS EA : Smart entries calculated by 4 great strategies The EA can be run on even a $2000
FREE
Follow The Line
Oliver Gideon Amofa Appiah
4 (13)
FOLLOW THE LINE GET THE FULL VERSION HERE: https://www.mql5.com/en/market/product/36024 This indicator obeys the popular maxim that: "THE TREND IS YOUR FRIEND" It paints a GREEN line for BUY and also paints a RED line for SELL.  It gives alarms and alerts of all kinds. IT DOES NOT REPAINT and can be used for all currency pairs and timeframes. Yes, as easy and simple as that. Even a newbie can use it to make great and reliable trades. NB: For best results, get my other premium indicators for more
FREE
1.毎月、毎週、および毎日のピボットは、各期間の開始データと終了データを使用して計算されます。 2.これにより、グラフ上に簡単な線が表示され、要点がどこにあるかを識別し、計算の誤差を減らすことができます。 3.インジケータは、ピボットの計算方法がわからなくても、楽器の主なピボットをすばやく定義するのに役立ちます。 あなたはより良い価格の位置を理解することができるようにあなたはまた、毎週と毎日のピボットを比較することができます。 5この指標は、あなたがより効果的に抵抗や支持に近いところで取引するのを助けます。 1. Maitsuki, maishū, oyobi mainichi no pibotto wa, kaku kikan no kaishi dēta to shūryō dēta o shiyō shite keisan sa remasu. 2. Kore ni yori, gurafu-jō ni kantan'na-sen ga hyōji sa re, yōten ga doko ni aru ka o shikibetsu shi, keisan
FREE
MegaTrends
Sivakumar Subbaiya
1 (1)
Megatrends  Indicator   Time Frame: Suitable for any time frame.  Purpose: Trend Prediction. Blue and red color indicate the buy and sell call respectively. Buy: When the blue line is originating it is opened buy call. Sell: When the Red line is origination it is opened sell call Happy trade!! this indicator is suitable for all time frame, but our recommended time frame to use 1hour and 4 hours, suitable for any chart.
FREE
Magic EA MT4
Kyra Nickaline Watson-gordon
3 (1)
Magic EA is an Expert Advisor based on Scalping, Elliot Waves and with filters such as RSI, Stochastic and 3 other strategies managed and decided with the robot smartly. Large number of inputs and settings are tested and optimized and embedded in the program thus inputs are limited and very simple. Using EA doesn't need any professional information or Forex Trading Knowledge. EA can trade on all symbols and all time frames, using special and unique strategies developed by the author. The EA
This powerful tool combines the Zigzag algorithm with Fibonacci retracement levels, enhancing your trading experience in the MetaTrader 4 (MT4) platform. Zigzag with Fibo Indicator Time Frame :- 1H and above The   Zigzag with Fibo Indicator   is designed to identify trend direction and provide precise entry and exit points for forex trading. Here’s what makes it stand out: Zigzag Algorithm Integration : The indicator utilizes the Zigzag algorithm, which helps filter out market noise and highligh
FREE
Trend PA
Mikhail Nazarenko
5 (3)
The Trend PA indicator uses   Price Action   and its own filtering algorithm to determine the trend. This approach helps to accurately determine entry points and the current trend on any timeframe. The indicator uses its own algorithm for analyzing price changes and Price Action. Which gives you the advantage of recognizing, without delay, a new nascent trend with fewer false positives. Trend filtering conditions can be selected in the settings individually for your trading style. The indicator
Necessary for traders: tools and indicators Waves automatically calculate indicators, channel trend trading Perfect trend-wave automatic calculation channel calculation , MT4 Perfect trend-wave automatic calculation channel calculation , MT5 Local Trading copying Easy And Fast Copy , MT4 Easy And Fast Copy , MT5 Local Trading copying For DEMO Easy And Fast Copy , MT4 DEMO Easy And Fast Copy , MT5 DEMO Strongly recommend trend indicators,   automatic calculation of wave standard   and   MT5 ve
FREE
LineBreakMT4
Nattadecha Tangpakinwat
Key Features: Type of Indicator: Line Break Chart Indicator Usage: Identifying trend reversals and potential market turning points. Input Parameters: The primary input parameter is 'Lines_Break,' which represents the number of lines the price needs to move to create a new line in the opposite direction. How it works: The indicator draws green and red histogram bars to represent the line break chart. Green bars indicate an upward trend, and red bars indicate a downward trend. The indicator calcul
FREE
このプロダクトを購入した人は以下も購入しています
Gann Made Easy は、ミスター・ギャンの理論を使用した取引の最良の原則に基づいた、プロフェッショナルで使いやすい外国為替取引システムです。 W・D・ガン。このインジケーターは、ストップロスとテイクプロフィットレベルを含む正確な買いと売りのシグナルを提供します。 PUSH通知を利用して外出先でも取引可能です。 購入後はご連絡ください!私の取引のヒントと素晴らしいボーナスインジケーターを無料で共有します! おそらく、ギャンの取引手法についてはすでに何度も聞いたことがあるでしょう。通常、ギャンの理論は初心者のトレーダーだけでなく、すでにある程度の取引経験がある人にとっても非常に複雑なものです。なぜなら、ギャンの取引手法は理論的にはそれほど簡単に適用できるものではないからです。私はその知識を磨き、最良の原則を私の外国為替インジケーターに組み込むために数年を費やしました。 このインジケーターは非常に簡単に適用できます。必要なのは、それをチャートに添付し、簡単な取引推奨事項に従うだけです。このインジケーターは常に市場分析の仕事を行い、取引の機会を探します。適切なエントリーポイントを検出
現在26%オフ 初心者やエキスパートトレーダーに最適なソリューション! このインジケーターは、独自の機能と新しい計算式を取り入れた、ユニークで高品質、かつ手頃な価格のトレーディングツールです。たった1枚のチャートで28の為替ペアの通貨強度を読み取ることができます。新しいトレンドやスキャルピングチャンスの引き金となるポイントを正確に特定することができるので、あなたのトレードがどのように改善されるか想像してみてください。 ユーザーマニュアルはこちら  https://www.mql5.com/en/blogs/post/697384 これが最初の1本、オリジナルだ! 価値のないクローンを買わないでください。 特別な サブウィンドウの矢印で強い通貨の勢いを表示 GAPがあなたのトレードを導く! 基準通貨や気配値が売られすぎ・買われすぎのゾーン(外相フィボナッチレベル)にあるとき、個別チャートのメインウィンドウに警告表示。 通貨がレンジの外側から反落した場合、プルバック/リバーサルのアラート。 クロスパターンの特別なアラート 複数の時間枠を選択可能で、トレンドを素早く
Trend Punch
Mohamed Hassan
5 (10)
Manual guide:   Click here PROMO of  $79 for 2 copies left!  -- Next price is  $149 .  This indicator is unstoppable when combined with our other indicator called  Support & Resistance . After purchase, send us a message and you will get it   for  FREE as a BONUS! I like to use Trend Punch on XAUUSD & BTCUSD on the M1 timeframe!  Introducing Trend Punch , the revolutionary forex trend indicator that will transform the way you trade! Trend Punch is uniquely designed to provide preci
An exclusive indicator that utilizes an innovative algorithm to swiftly and accurately determine the market trend. The indicator automatically calculates opening, closing, and profit levels, providing detailed trading statistics. With these features, you can choose the most appropriate trading instrument for the current market conditions. Additionally, you can easily integrate your own arrow indicators into Scalper Inside Pro to quickly evaluate their statistics and profitability. Scalper Inside
Reversal First Impulse levels (RFI)    INSTRUCTIONS        RUS       -       ENG              R ecommended to use with an indicator   -   TREND PRO -  Version MT5 A key element in trading is zones or levels from which decisions to buy or sell a trading instrument are made. Despite attempts by major players to conceal their presence in the market, they inevitably leave traces. Our task was to learn how to identify these traces and interpret them correctly. Main functions: Displaying active zones
まず第一に、この取引インジケーターは再描画されず、再描画されず、遅延しないことを強調する価値があります。これにより、手動取引とロボット取引の両方に理想的なものになります。 ユーザーマニュアル:設定、入力、戦略。 アトミックアナリストは、価格の強さとモメンタムを利用して市場でより良いエッジを見つけるためのPA価格アクションインジケーターです。ノイズや誤ったシグナルを除去し、取引ポテンシャルを高めるための高度なフィルターを備えています。複雑なインジケーターの複数のレイヤーを使用して、アトミックアナリストはチャートをスキャンし、複雑な数学的計算をシンプルなシグナルと色に変換します。これにより、どのような初心者トレーダーでも理解して使用し、一貫した取引の決定を行うことができます。 「アトミックアナリスト」は、新規および経験豊富なトレーダー向けにカスタマイズされた包括的な取引ソリューションです。プレミアムインジケーターとトップノッチの機能を1つの取引戦略に組み合わせ、すべてのタイプのトレーダーにとって汎用性のある選択肢にします。 デイリートレーディングとスキャルピング戦略:高
Advanced Supply Demand
Bernhard Schweigert
4.92 (312)
現在33%オフ 初心者にもエキスパートトレーダーにも最適なソリューション このインジケーターは独自の機能と新しい公式を多数内蔵しており、ユニークで高品質かつ手頃な取引ツールです。このアップデートでは、2つの時間枠ゾーンを表示できるようになります。より長いTFだけでなく、チャートTFとより長いTF(ネストゾーンを表示)の両方を表示できます。すべてのSupply Demandトレーダーの皆さんのお気に召すはずです。:) 重要情報の公開 Advanced Supply Demandの可能性を最大化するには、 https://www.mql5.com/ja/blogs/post/720245 にアクセスしてください。   エントリーまたはターゲットの正確なトリガーポイントを正確に特定できれば取引がどのように改善されるか想像してみてください。新しい基盤となるアルゴリズムに基づいて構築されているため、買い手と売り手の間の潜在的な不均衡をさらに簡単に特定できます。これは、最も強い需要と供給のゾーンと、過去のパフォーマンス(古いゾーンを表示)がグラフィカルに表現されるためです。これらの機能は、最適
ブレーカートレーダーになり、価格が反転すると市場構造からの利益が変化します。 注文ブロックブレーカーインジケーターは、トレンドまたは価格の動きが枯渇に近づいており、逆転の準備ができていることを識別します。通常、反転または大規模なプルバックが発生しようとしているときに発生する市場構造の変化について警告します。 この指標は、ブレイクアウトと価格の勢いを識別する独自の計算を使用します。使い果たされる可能性のあるポイントの近くで新しい高値が形成されるたびに、インディケーターはその高値の作成を担当する最後の注文ブロックを描きます。次に、移動する価格とともに注文ブロックを追跡します。その後、価格が反対方向にシフトし、その注文ブロックを突破すると、新しい市場構造を作成し、トレンドまたは大きな後退の可能性のある反転の開始を警告します。 注文ブロックは、高値/安値が作成される前の最後の反対色のろうそくであり、価格がこれらの重要な領域を下抜けすると、トレンドの短期的ま​​たは長期的な反転の兆候です。 特徴 重要な枯渇点での市場構造の変化を警告します 価格が使い果たされるレベルに近づくと、
現在20%OFF! 初心者やエキスパートトレーダーのためのベストソリューション! このダッシュボードソフトウェアは、28の通貨ペアで動作しています。それは私達の主要な指標(高度な通貨の強さ28と高度な通貨インパルス)の2に基づいています。それは全体の外国為替市場の大きい概観を与えます。それは、すべての(9)時間枠で28の外国為替ペアのための高度な通貨の強さの値、通貨の動きの速度と信号を示しています。チャート上で1つのインディケータを使用して市場全体を観察し、トレンドやスキャルピングの機会をピンポイントで見つけることができたら、あなたのトレードがどのように改善されるか想像してみてください。 このインディケータには、強い通貨と弱い通貨の識別、潜在的な取引の識別と確認がより簡単になるような機能が搭載されています。このインディケータは、通貨の強さや弱さが増加しているか減少しているか、また、すべての時間枠でどのように機能しているかをグラフィカルに表示します。 新機能として、現在の市場環境の変化に適応するダイナミックなマーケットフィボナッチレベルが追加され、すでに当社のAdvan
TPSpro TRENDPRO  - is a trend indicator that automatically analyzes the market and provides information about the trend and each of its changes, as well as giving signals for entering trades without redrawing! The indicator uses each candle, analyzing them separately. referring to different impulses - up or down impulse. Exact entry points into transactions for currencies, crypto, metals, stocks, indices!  -  Version MT5               DETAILED DESCRIPTION                R ecommended to use with
Legacy of Gann
Pavel Zamoshnikov
4.83 (12)
The indicator very accurately determines the levels of the possible end of the trend and profit fixing. The method of determining levels is based on the ideas of W.D.Gann, using an algorithm developed by his follower Kirill Borovsky. Extremely high reliability of reaching levels (according to K. Borovsky  - 80-90%) Indispensable for any trading strategy – every trader needs to determine the exit point from the market! Precisely determines targets on any timeframes and any instruments (forex, met
mql5と Telegramの モーニング・ブリーフィングで、詳細とスクリーンショットを含む毎日のマーケット・アップデートをご覧 ください! FX Power MT4 NGは 、長年の人気を誇る通貨強度計FX Powerの次世代モデルです。 この次世代ストレングスメーターは何を提供するのでしょうか?初代FXパワーの魅力すべて プラス GOLD/XAUの強さ分析 より正確な計算結果 個別に設定可能な分析期間 カスタマイズ可能な計算上限値により、さらに優れたパフォーマンスを実現 もっと見たい人のための特別なマルチインスタンス設定 すべてのチャートでお好みの色を無限に設定可能 数え切れないほどの通知オプションにより、重要なことを見逃すことはありません。 Windows 11とmacOSのスタイルで角を丸くした新しいデザイン 魔法のように動くインジケーターパネル FXパワーの主な機能 すべての主要通貨の強さの完全な履歴 すべての時間枠における通貨の強さの履歴 すべてのブローカーとチャートで同一の計算結果 100%信頼できるリアルタイム計算 -> リペイントなし ドロップダウン・リストから
FX Volume
Daniel Stein
4.6 (35)
mql5と Telegramの モーニング・ブリーフィングで、詳細とスクリーンショットを含む毎日のマーケット・アップデートをご覧 ください! FX Volumeは、ブローカーの視点から市場のセンチメントをリアルに洞察する、最初で唯一の出来高インジケーターです。 ブローカーのような機関投資家が外国為替市場でどのようなポジションをとっているか、COTレポートよりもはるかに速く、素晴らしい洞察を提供します。 この情報をチャート上で直接見ることは、あなたの取引にとって真のゲームチェンジャーであり、画期的なソリューションです。 以下のようなユニークなマーケットデータ洞察から利益を得てください。 比率は 、通貨のロングポジションとショートポジションの比率をパーセントで表示します。 比率の変化は 、選択した期間内のロング比率とその変化率を表示します。 Volumes Totalは 、通貨の取引量(ロングとショート)の合計をロット単位で表示します。 Volumes Long :全通貨のロングポジションの取引量を表示します。 Volumes(ショート )は、全通貨のショートポジションの取引量を表示
Gold Stuff
Vasiliy Strukov
4.89 (259)
Gold Stuff は、金専用に設計されたトレンド指標であり、あらゆる金融商品にも使用できます。 インジケーターは再描画せず、遅れません。 推奨時間枠 H1. それインディケータでフルオートExpert Advisor EA Gold Stuffが動作します。 あなたは私のプロフィールでそれを見つけることができます. 設定と個人的なボーナスを得るために、購入後すぐに私に連絡してください! トレンド スキャナーの強力なサポートを利用して、無料のインジケーターを入手し、プライバシーを守ります。あーみー!   設定 矢印を描く - オンオフ。 チャートに矢印を描く。 アラート - 可聴アラートのオンオフ。 メール通知 - オンオフ。 電子メール通知。 プチ通知 - オンオフ。 プッシュ通知。 次に、色域を調整します。 Gold Stuff は、金専用に設計されたトレンド指標であり、あらゆる金融商品にも使用できます。 インジケーターは再描画せず、遅れません。 推奨時間枠 H1. それインディケータでフルオートExpert Advisor EA Gold Stuff
Auto Order Block with break of structure based on ICT and Smart Money Concepts (SMC) Futures Break of Structure ( BoS )             Order block ( OB )            Higher time frame Order block / Point of Interest ( POI )    shown on current chart           Fair value Gap ( FVG ) / Imbalance   -  MTF      ( Multi Time Frame )    HH/LL/HL/LH  -  MTF      ( Multi Time Frame )  Choch  MTF      ( Multi Time Frame )  Volume Imbalance     ,  MTF          vIMB Gap’s Power of 3 Equal High
まず第一に、この取引ツールはノンリペイント、ノンリドロー、ノンラグの指標であり、プロの取引に理想的ですことを強調する価値があります。 オンラインコース、ユーザーマニュアル、デモ。 スマートプライスアクションコンセプトインジケーターは、新米から経験豊富なトレーダーまで、非常 に強力なツールです。Inner Circle Trader AnalysisやSmart Money Concepts Trading Strategiesなど、20以上の有用な指標を1つに組み合わせています。このインジケーターはスマートマネーコンセプトに焦点を当て、大手機関の取引方法を提供し、彼らの動きを予測するのに役立ちます。 特に、流動性分析に優れており、機関がどのように取引しているかを理解しやすくしています。市場のトレンドを予測し、価格の動きを慎重に分析するのに優れています。機関の戦略とトレードを合わせることで、市場の動向についてより正確な予測ができます。このインジケーターは多目的であり、市場構造を分析し、重要な注文ブロックを特定し、さまざまなパターンを認識するのに優れています。 このインジケー
ICT, SMC, SMART MONEY CONCEPTS, SMART MONEY, Smart Money Concept, Support and Resistance, Trend Analysis, Price Action, Market Structure, Order Blocks, BOS/CHoCH,   Breaker Blocks ,  Momentum Shift,   Supply&Demand Zone/Order Blocks , Strong Imbalance, HH/LL/HL/LH,    Fair Value Gap, FVG,  Premium  &   Discount   Zones, Fibonacci Retracement, OTE, Buy Side Liquidity, Sell Side Liquidity, BSL/SSL Taken, Equal Highs & Lows, MTF Dashboard, Multiple Time Frame, BigBar, HTF OB, HTF Market Structure, 
カスタムMT4インジケーターで外国為替取引を成功させるための秘密を発見してください! 外国為替市場で成功を達成し、リスクを最小限に抑えながら一貫して利益を得る方法を疑問に思ったことはありますか? これがあなたが探している答えです! 取引へのアプローチに革命をもたらす独自のMT4インジケーターを導入できるようにします。 ユニークな汎用性 私たちのインジケータは、RenkoとRangeBarのろうそくのフォーメーションを好むユーザー向けに特別に設計されています。 これらのチャートタイプは多くの経験豊富なトレーダーに好まれていることを理解しています。そのため、私たちのインジケーターはそれらとシームレスに統合され、比類のない市場分析を提供します。 クリアトレンドシグナル 複雑な分析を忘れてください! 私たちのインジケーターは、鮮やかな色と明確なドット構造を利用して、市場の動向を明確に示しています。 赤と青の点は、価格の動きの方向性について疑いの余地がなく、取引の迅速な意思決定を可能にします。 HH/HL HL/LL戦略とのアライメント HH/HLおよびHL/LL構
Volatility Trend System - a trading system that gives signals for entries. The volatility system gives linear and point signals in the direction of the trend, as well as signals to exit it, without redrawing and delays. The trend indicator monitors the direction of the medium-term trend, shows the direction and its change. The signal indicator is based on changes in volatility and shows market entries. The indicator is equipped with several types of alerts. Can be applied to various trading
TakePropips Donchian Trend Pro
Eric John Pajarillaga Aldana
4.82 (17)
TakePropips Donchian Trend Pro   (MT4) は、ドンチャン チャネルを使用してトレンドの方向を自動的に検出し、エントリーとエグジットの取引シグナルを提供する強力で効果的なツールです! この多機能インジケーターには、トレンド スキャナー、取引シグナル、統計パネル、スクリーナー、取引セッション、およびアラート履歴ダッシュボードが含まれます。取引シグナルを提供し、チャートを分析する時間を節約するように設計されています! ユーザー マニュアルとインストール ガイドは、ブログ投稿 (   https://www.mql5.com/en/blogs/post/751368   ) からダウンロードできます。 今日は 50% オフ! 98ドルから49ドルに値下げ! このインジケーターは、ストラテジー テスターでテストできます (ビジュアル モードを有効にします)。 詳細については、説明の下にあるビデオ チュートリアルも利用できます。 ご不明な点やサポートが必要な場合は、私に連絡してください。 TakePropips Donchian Trend Pro イン
通貨強さウィザードは、取引を成功させるためのオールインワン ソリューションを提供する非常に強力な指標です。このインジケーターは、複数の時間枠のすべての通貨のデータを使用して、このまたはその外国為替ペアのパワーを計算します。このデータは、使いやすい通貨インデックスと通貨パワーラインの形式で表され、特定の通貨のパワーを確認するために使用できます。 必要なのは、取引したいチャートにインジケーターを接続することだけです。インジケーターは、取引する通貨の実際の強さを示します。このインジケーターは、トレンドに合わせて取引するときに有利に利用できる売買高の圧力の極値も示します。このインジケーターには、フィボナッチに基づく可能なターゲットも表示されます。 このインジケーターは、PUSH 通知を含むあらゆるタイプのアラートを提供します。 購入後ご連絡下さい。私の取引のヒントをあなたと共有し、素晴らしいボーナスインジケーターを無料で提供します! 幸せで有益な取引をお祈りします。
Break and Retest
Mohamed Hassan
4.43 (14)
New update to V.4 where  Break & Retest automatically draws the take profit & stop loss levels and you also have more signals per day! ‍You can visually backtest Break & Retest to see how it behaved in the past!     Manual guide:   Click here $60 for a very limited time. Next price is $120   This Indicator only places quality trades when the market is really in your favor with a clear break and retest. Patience is key with this price action strategy! If you want more alert s
Trend Screener
STE S.S.COMPANY
4.83 (88)
トレンドインジケーター、1つのツールに組み込まれたすべての重要なトレンド機能を備えたトレンドトレーディングとフィルタリングのための画期的なユニークなソリューション! これは、すべてのシンボル/商品(外国為替、商品、暗号通貨、インデックス、株式)で使用できる100%再描画されていないマルチタイムフレームおよびマルチ通貨インジケーターです。 トレンドスクリーナーは、チャート内のドットで矢印トレンドシグナルを提供するインジケーターに続く効率的なインジケーターです。 トレンド分析インジケーターで使用できる機能: 1.トレンドスキャナー。 2.最大利益分析を備えたトレンドライン。 3.トレンド通貨強度メーター。 4.アラート付きのトレンド反転ドット。 5.アラート付きの強いトレンドドット。 6.トレンド矢印 毎日の分析例、毎日のシグナルパフォーマンス...など、トレンドスクリーナーインジケーターを使用して、ここで見つけることができます: ここをクリックしてください 期間限定オファー:トレンドスクリーナーインジケーターは、50ドルと生涯でのみご利用いただけます。 (元の価格125 $) MQ
市場の2つの基本原則に基づく日中戦略。 このアルゴリズムは、追加のフィルターを使用したボリュームと価格の波の分析に基づいています。インディケータのインテリジェントアルゴリズムは、2つの市場要因が1つに結合した場合にのみシグナルを出します。インディケータは、より高い時間枠のデータを使用して、M1チャート上の特定の範囲の波を計算します。そして波を確認するために、インジケーターはボリュームによる分析を使用します。 このインディケータはレディトレーディングシステムです。トレーダーが必要とするのは、信号に従うことだけです。また、インジケーターはあなた自身の取引システムの基礎になることができます。取引はミニッツチャートでのみ行われます。 インジケーターがMTFの原則を使用しているという事実にもかかわらず、インジケーターのアルゴリズムは可能な限り安定しています。 購入後、必ず私に書いてください!私の取引設定と推奨事項をあなたと共有します!
NAM Order Blocks
NAM TECH GROUP, CORP.
5 (1)
MT4マルチタイムフレームオーダーブロック検出インジケーター。 特徴 -チャートコントロールパネルで完全にカスタマイズ可能で、完全な相互作用を提供します。 -必要な場所でコントロールパネルを表示および非表示にします。 -複数の時間枠でOBを検出します。 -表示するOBの数量を選択します。 -さまざまなOBユーザーインターフェイス。 -OBのさまざまなフィルター。 -OB近接アラート。 -ADRの高線と低線。 -通知サービス(画面アラート|プッシュ通知)。 概要 注文ブロックは、金融機関や銀行からの注文収集を示す市場行動です。著名な金融機関と中央銀行が外国為替市場を牽引しています。したがって、トレーダーは市場で何をしているのかを知る必要があります。市場が注文ブロックを構築するとき、それは投資決定のほとんどが行われる範囲のように動きます。 注文の構築が完了すると、市場は上向きと下向きの両方に向かって急激に動きます。注文ブロック取引戦略の重要な用語は、機関投資家が行っていることを含むことです。それらは主要な価格ドライバーであるため、機関投
現在31%オフ! 初心者やエキスパートトレーダーに最適なソリューション! このインジケータは、独自の機能と秘密の数式を組み込んだ、ユニークで高品質かつ手頃な価格のトレーディングツールです。たった1枚のチャートで28の通貨ペアのアラートを表示します。新しいトレンドやスキャルピングチャンスの引き金となるポイントを正確に把握することができるので、あなたのトレードがどのように改善されるか想像してみてください! 新しい基本的なアルゴリズムに基づいて構築されているため、潜在的な取引の特定と確認がより簡単になります。これは、通貨の強さや弱さが加速しているかどうかをグラフィカルに表示し、その加速のスピードを測定するためです。加速すると物事は明らかに速く進みますが、これはFX市場でも同じです。つまり、反対方向に加速している通貨をペアにすれば、利益を生む可能性のある取引を特定することができるのです。 通貨の勢いを示す縦の線と矢印は、あなたの取引の指針となるでしょう。 ダイナミックマーケットフィボナッチ23レベルはアラートトリガーとして使用され、市場の動きに適応します。もしインパルスが黄色
これはMT4のインジケーターで、再描画なしで取引に参入するための正確なシグナルを提供します。 外国為替、暗号通貨、金属、株式、インデックスなど、あらゆる金融資産に適用できます。かなり正確な見積もりを提供し、取引を開始して終了するのに最適な時期を教えてくれます。1つのシグナルを処理しただけでインジケーターの元が取れた例の 動画 (6:22)をご覧ください。Entry PointsPro インジケーターの助けを借りたほとんどのトレーダーの最初の1週間の結果が改善しています。 Telegramグループ に登録してください。Entry Points Proインジケーターのメリットは次の通りです。 再描画のないエントリーシグナル 再描画されるインジケーターでは一度表示されたシグナルが削除されて大きな金銭的損失につながることがありますが、これと異なり、表示されて確認されたシグナルは消えることがありません。 エラーなしの取引開始 インジケーターアルゴリズムによって取引を開始する(資産を売買する)理想的な瞬間を見つけることができます。それを使用するすべてのトレーダーの成功率が向上します。
BullseyeSignal – NoRepaint は、名前が示すように、いかなる状況でも再描画されないシグナルです。シグナルは画像に表示された同じローソク足に表示されます。外為、暗号通貨、株式、指数、先物などの高ボラティリティ市場に最適です。 購入には緑の矢印、販売には赤の矢印のみが表示されますが、その背後にはより簡潔な取引体験を提供するために多くの指標が協力しています。 これは正確なエントリーを提供するために特別に設計されています。 多くのエントリーではなく、指標がトレンドの変化を示し、前のトレンドの反対方向に0レベルを超えたときに特定のエントリーを提供します。より正確な取引を実現するために、指標はトレンドの変化を確認するために最初のプルバックを待ち、偽の逆転を回避します。したがって、前のトレンドのブレイクとプルバックの確認後にシグナルが発行されます。 これは非常に慎重な取引アプローチです。 したがって、これらのヒントに従うことが重要です(初心者および上級トレーダーの両方がこの戦略を使用できます): ニューヨーク、ロンドン、または両市場の重複を使用することをお勧めします。
PRO Renko Systemは、特別にRENKOチャートを取引するために設計された高精度の取引システムです。 これは、様々な取引商品に適用することができる普遍的なシステムです。 システムは効果的に正確な逆転信号へのアクセスを与えるいわゆる市場の騒音を中和する。 表示器は非常に使いやすく、信号の生成に責任がある1つの変数だけがあります。 あなたは簡単にお好みの任意の取引ツールとレンコバーのサイズにツールを適応させることができます。 私はいつもあなたが私のソフトウェアで収益性の高い取引を支援するために余分なサポートを提供する準備ができています! 私はあなたに幸せで収益性の高い取引をしたいです! ご購入後にご連絡ください! 私はあなたに私のレンコチャートジェネレータを送信します。 私はまた、私の個人的な推奨事項やシステムの他のモジュールを無料で共有します!
TrendMaestro
Stefano Frisetti
5 (3)
note: this indicator is for METATRADER4, if you want the version for METATRADER5 this is the link:  https://www.mql5.com/it/market/product/108106 TRENDMAESTRO ver 2.4 TRENDMAESTRO recognizes a new TREND in the bud, he never makes mistakes. The certainty of identifying a new TREND is priceless. DESCRIPTION TRENDMAESTRO identifies a new TREND in the bud, this indicator examines the volatility, volumes and momentum to identify the moment in which there is an explosion of one or more of these data a
作者のその他のプロダクト
The indicator is designed to detect range market or consolidation areas on the chart. It does this by using the market volatility and price momentum. The indicator signals the start and stop of the range with icons on the chart and various  type of alerts options provided in the input settings. Usage: The indicator can be used to check the state of the market i.e. trending or ranging to make appropriate decision and use strategies designed for specific market state. Please see the attached video
The indicator builds a Renko chart in the sub window for the current symbol. The bars are formed from live data and the desired bar size can be set in the inputs tab. Most importantly, because the Renko chart only uses price to construct bars and ignores time, the indicator can be applied to any time frame and same results can be achieved. Recommended usage As Renko charts are famous for eliminating noise so traders can use this tool to see clear picture of the trend to help their analysis, ent
FREE
Informative & optimized Zigzag, Accumulated volume, Price change   A rewrite of the traditional zigzag tool with new additions. Features:- Optimized code Displays accumulated volume between peaks Displays price change between peaks Usage:- Identify trend swings Identify high volume swings Compare price changes between swings Drawing Fibonacci tool on strong price change or high volume swings
FREE
The indicator helps the trader in identifying potential liquidity levels. The algorithm used in this indicator checks the behavior of the asset taking into account the price levels, momentum and volume analysis. Features:- Parameters for signal optimization and alerts. Usage:- The levels formed by the indicator can be helpful to traders in identifying potential entries, breakouts or reversals. it can assist traders of technical trading background or even pure price action trading. Examples o
Algorithmic Signals indicator   is not an indicator but a strategy that generates entry/exit signals. The entry arrows are formed after multiple conditions are met. The indicator is using an   Adaptive Algorithm   which automatically adjust to the symbol and time frame (see the screenshots below) . Signals can be used for scalping or even trend trading. Main features:- Non repainting signals Entry signals Exit signals Alert for price reaching 1 x ATR(14) (could be utilized for initial take prof
RSI Scanner, Multiple Symbols and Timeframes, Graphical User Interface An indicator that scans multiple symbols added from the market watch and timeframes and displays result in a graphical panel. Features: Multi symbol Multi timeframe Alerts and Notifications Live Monitoring Sorting modes One click to change symbol and timeframe Inputs for RSI and scanner settings
FREE
ADR Bands
Navdeep Singh
4.33 (3)
Average daily range, Projection levels, Multi time-frame ADR bands shows levels based on the selected time-frame. Levels can be used as projections for potential targets, breakouts or reversals depending on the context in which the tool is used. Features:- Multi time-frame(default = daily) Two coloring modes(trend based or zone based) Color transparency  
FREE
IBB Candles is a tool that is based on the concept of Inverse Bollinger Bands. It compares price relative to state of the bands and plots candles with different colors defining the current state of the market i.e range | trend | strong trend. As the name suggests IBB(Inverse Bollinger Bands) is a technique which is completely different from the traditional Bollinger Bands and proves to be much more effective in analyzing market. This personal implementation makes this tool a more reliable optio
Stochastic force is an advanced version of the stochastic oscillator. Instead of using the regular price a more efficient price data is provided as an input for the oscillator which takes into account the price efficiency, volume and market noise. Also price is pre-filtered with the selected average type and then post-filtered by a hull moving average which provides a smooth transition of the oscillator. It eliminates maximum false signals and has the potential to become an integral part of any
This is the new version of the Algorithmic signals featuring a new algorithm. It is a blend of technical and candlestick analysis. Candlestick analysis are often ignored while creating technical strategies but this version has a feature to include that and make confirmations more strong.  Usage:- Traders can use the signals for buying and selling assets or even blend their own favorite indicators with it.
TDI Signals generates buy and sell arrows based on a TDI(Traders Dynamic Index) algorithm. It looks for price breakouts, continuations and reversals. By default it runs in the trend mode but user is provided with the option to change that to reversal mode. Trader can use the mode which compliments his/her trading style.  Usage:-   TDI Signals can be used as a stand alone indicator with context or even be added to strategies to make confirmations more strong. Volatility based stop loss, take pr
RSI Levels generates buy and sell arrows based on RSI analysis. Signals are based on extreme levels breakouts and can be further filtered by a volatility metric. Trader can use the mode which compliments his/her trading style.  Features:- Parameters for signal optimization and alerts. Usage:-   RSI Levels can be used as a stand alone indicator with context or even be added to strategies to make confirmations more strong. Volatility based stop loss, take profit & position sizing can be very helpf
Step force index is a modified version of the famous force index indicator. As the name suggests it incorporates a step feature to filter the force index values thus eliminating small fluctuations in the indicator. It also utilizes the smooth algorithm library thereby providing multiple smoothing options for the index values. This personal implementation makes it a more easy to use and a reliable tool. Main features A wide range of parameters for signals optimization Alerts, emails and push noti
CMA dashboard is designed to help traders in identifying trend on multiple timeframes and symbols. It displays a clear state of the overall trend at one place without the need to navigate between different charts and timeframes. This saves time and makes decision making process fast so that potential opportunities are not missed. It is based on Corrected moving averages available here Features Parameters for signal optimization Inputs for multiple timeframes and symbols  Usage Higher timeframe
IBB Candles is a tool that is based on the concept of Inverse Bollinger Bands. It compares price relative to state of the bands and plots candles with different colors defining the current state of the market i.e range | trend | strong trend. As the name suggests IBB(Inverse Bollinger Bands) is a technique which is completely different from the traditional Bollinger Bands and proves to be much more effective in analyzing market. This personal implementation makes this tool a more reliable option
Market structures, Market balance, Range breakouts This tools helps to identify areas of market ranges, structures and plots colored boxes on breakout of those areas. User is given the option to receive alerts and notifications on the formation of the blocks. The tool has the ability to become an essential part of a technical trading system or even pure price action trading. Usage:- An essential tool for price action or technical traders.  More information in the blog
Horizontal volume bars, Cluster analysis, Volume profile Volume in Range gets information about the accumulated volume in a specified vertical range and period in bars. The received data is then plotted on the chart as rectangular boxes with the volume quantity inside. Usage:- The tool acts as a support resistance levels but most importantly it should be used to check in which direction the price breaks out of the significant levels formed by this indicator and then actions to be taken on correc
This utility is specifically designed for No Nonsense Forex traders. What it does:- Let traders add or remove symbols to trade Editable boxes in panel for updating inputs Automatically applies money management to the trades Places all orders with a single click  How it calculates:- Two trades are opened per symbol By default max risk per trade is 1% By default total risk is 6% which can changed in inputs tab(recommended to keep it 6 or below)  On addition of symbols the total risk will be divide
Market Fractal Analysis, Fractal Swing, Market Flow Fractal Cycles looks for Similar Patterns in the Market that repeat themselves because of the Market Fractal Nature. These patterns are displayed with help of Graphical Objects and Alerts can be received on their arrival. Read the Blog for full information. Features:- Auto Detection of Patterns Customization for Color and Line Styles Alerts, Emails & Push Notifications 
50+ Candlestick Patterns, Simulated Trading Results, Top Five Performers Candle Analysis extends Candlesticks Pattern Analysis by not only identifying Patterns but also recording the Past Performance of the Patterns. What it Does:- Identifies and plots results on chart Displays Top Patterns for both Bullish and Bearish type.  Log can be printed in experts tab to see Simulated Trading results Displays All or Selected Patterns Alerts on Pattern formation More detailed information in Blog
Stochastic force is an advanced version of the stochastic oscillator. Instead of using the regular price a more efficient price data is provided as an input for the oscillator which takes into account the price efficiency, volume and market noise. Also price is pre-filtered with the selected average type and then post-filtered by a hull moving average which provides a smooth transition of the oscillator. It eliminates maximum false signals and has the potential to become an integral part of any
The indicator helps the trader in identifying potential liquidity levels. The algorithm used in this indicator checks the behavior of the asset taking into account the price levels, momentum and volume analysis. Features:- Parameters for signal optimization and alerts. Usage:- The levels formed by the indicator can be helpful to traders in identifying potential entries, breakouts or reversals. it can assist traders of technical trading background or even pure price action trading.
Horizontal volume bars, Cluster analysis, Volume profile Volume in Range gets information about the accumulated volume in a specified vertical range and period in bars. The received data is then plotted on the chart as rectangular boxes with the volume quantity inside. Usage:- The tool acts as a support resistance levels but most importantly it should be used to check in which direction the price breaks out of the significant levels formed by this indicator and then actions to be taken on correc
Market structures, Market balance, Range breakouts This tools helps to identify areas of market ranges, structures and plots colored boxes on breakout of those areas. User is given the option to receive alerts and notifications on the formation of the blocks. The tool has the ability to become an essential part of a technical trading system or even pure price action trading. Usage:- An essential tool for price action or technical traders.  More information in the blog
Market Fractal Analysis, Fractal Swing, Market Flow Fractal Cycles looks for Similar Patterns in the Market that repeat themselves because of the Market Fractal Nature. These patterns are displayed with help of Graphical Objects and Alerts can be received on their arrival. Read the   Blog   for full information. Features:- Auto Detection of Patterns Customization for Color and Line Styles Alerts, Emails & Push Notifications
50+ Candlestick Patterns, Simulated Trading Results, Top Five Performers Candle Analysis extends Candlesticks Pattern Analysis by not only identifying Patterns but also recording the Past Performance of the Patterns. What it Does:- Identifies and plots results on chart Displays Top Patterns for both Bullish and Bearish type.  Log can be printed in experts tab to see Simulated Trading results Displays All or Selected Patterns Alerts on Pattern formation More detailed information in   Blog
フィルタ:
レビューなし
レビューに返信