Expanding form MT5
- インディケータ
- Dmitry Fedoseev
- バージョン: 1.1
- アクティベーション: 5
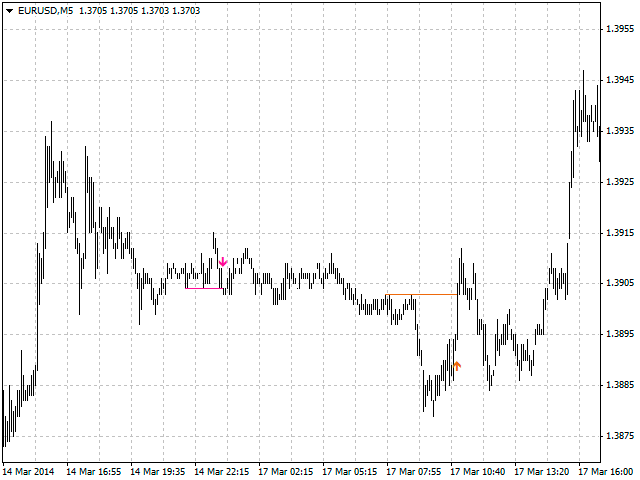
An indicator of patterns #2 and #3 ("Broadening formation right-angled and ascending" and "Broadening formation right-angled and descending") from Encyclopedia of Chart Patterns by Thomas N. Bulkowski.
Parameters:
- Alerts - show alert when an arrow appears
- Push - send a push notification when an arrow appears (requires configuration in the terminal)
- PeriodBars - indicator period
- K - an additional parameter that influences the accuracy of pattern shape recognition. The smaller the value is, the smoother the row of peaks/valleys should be, so fewer patterns will be recognized
- ArrowType - a symbol from 1 to 17
- ArrowVShift - vertical shift of arrows in pixels
- ShowLevels - show levels
- ColUp - color of an upward line
- ColDn - color of a downward line.
Note. Arrows appear on a forming bar and do not disappear.
It cannot be guaranteed that the indicator recognizes the patterns exactly as implied by the author.
Recommended optimization parameters: PeriodBars, K.