The Extreme System
- インディケータ
- Anton Iudakov
- バージョン: 1.0
Defines extremes.
This indicator consists of two parts.
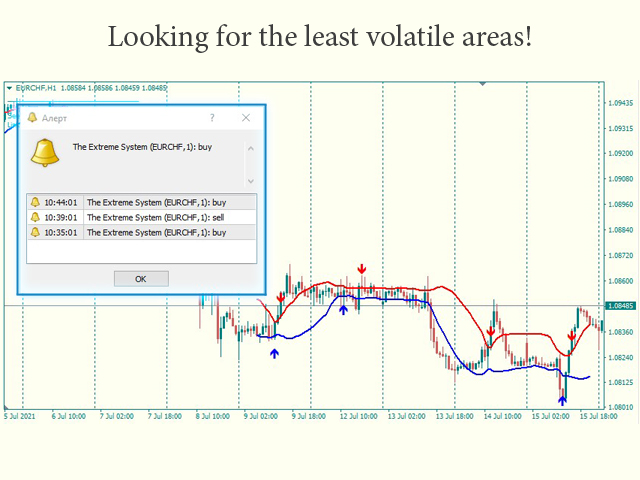
- The first draws lines on the chart indicating low volatility in relative daily market activity.
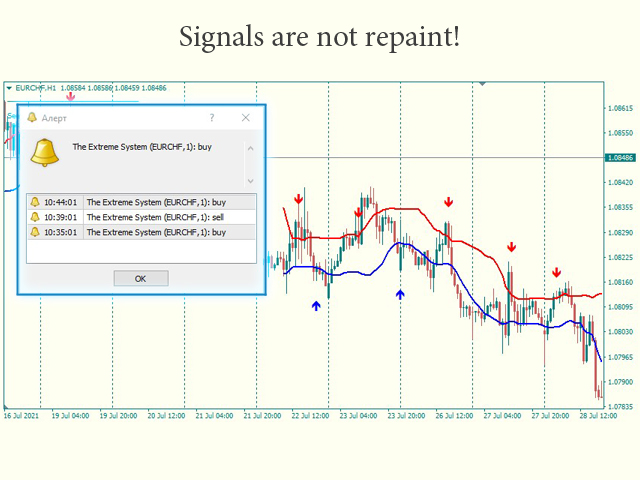
- The second is responsible for determining the extremum and gives signals to buy or sell.
This system is suitable for all instruments.
It is recommended to use a timeframe from m15 to h4.
Before using, you need to choose the settings for yourself.
- Configure lines deviation.
- Specify volatility coefficient.
Advantages
- The indicator does not repaint its signals.
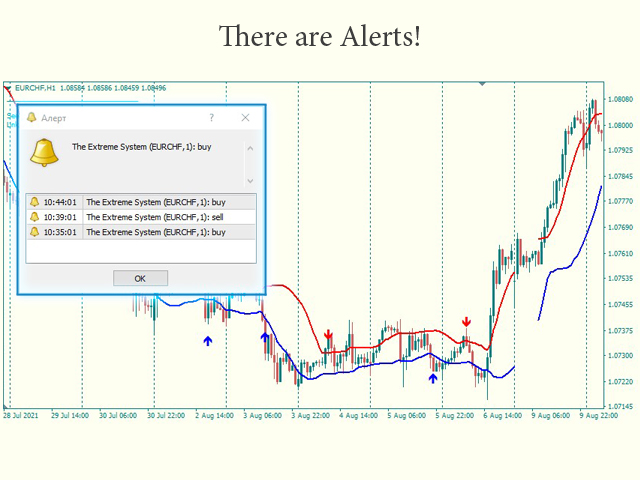
- There are signal alerts.
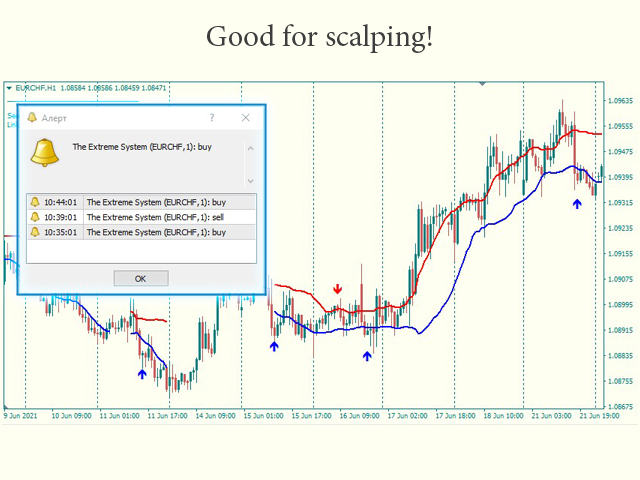
- Perfect for intraday scalping.
Settings:
| Name | Description |
|---|---|
| Indicator period | Indicator period |
| Deviation | Deviation of lines |
| Trend Strength Factor | Volatility Ratio. Set values from 0.1 to 1.0 |
| Distance for arrows | Distance to draw the arrow of the corresponding signal. If 0 - will be drawn at the opening point of the candle. |
| Alerts | Alert permission. |
Also see other products of this author:
https://www.mql5.com/ru/users/tonybeat/seller
Subscribe to my telegram channel, where we discuss intraday trading, ideas, indicators, etc., a link in my profile contacts.