Pivot Types with Levels MTF
- インディケータ
- John Louis Fernando Diamante
- バージョン: 1.9
- アップデート済み: 1 2月 2022
- アクティベーション: 5
Fully featured Pivots and Levels indicator
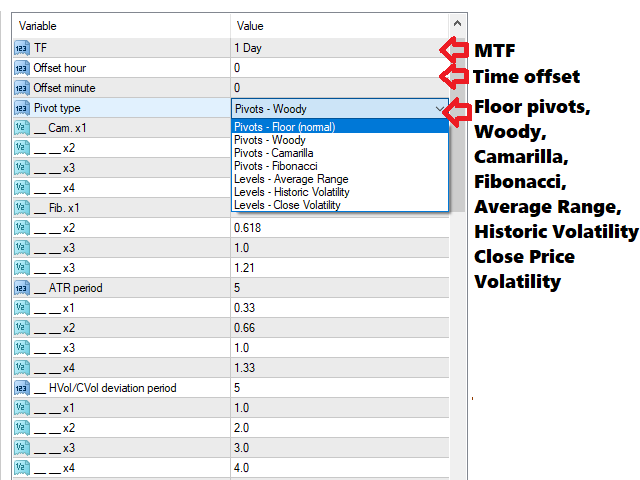
Pivots: Floor (normal), Woody, Camarilla, Fibonacci
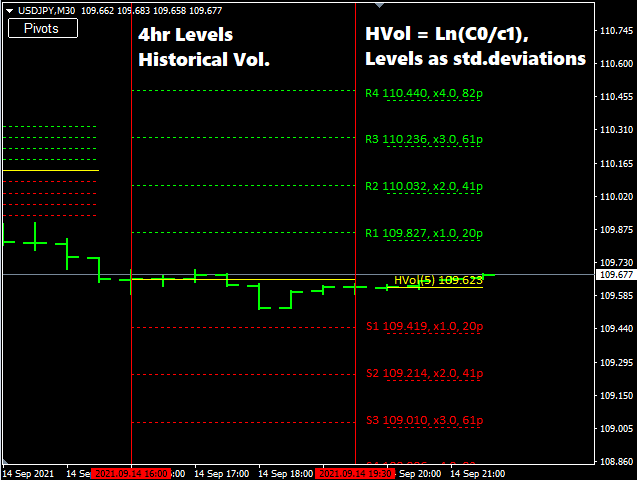
Levels: ATR, Historical Volatility with standard deviations, Close Price Volatility with standard deviations
Features:
- 4 +/- levels
- MTF, pivots/levels based on Daily, Weekly, 4hr or even 15min
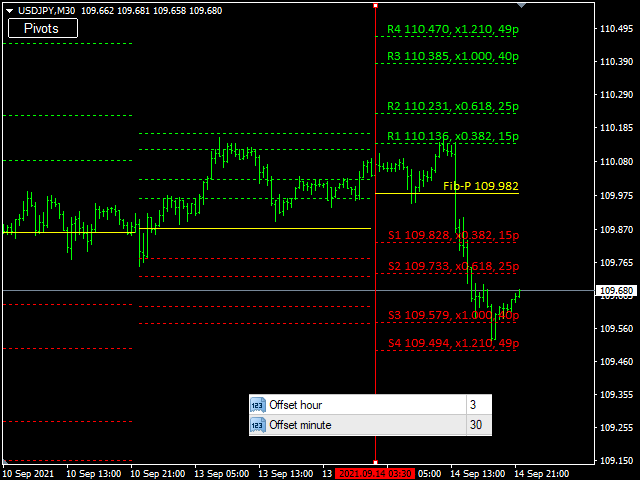
- Hour and minute time offset
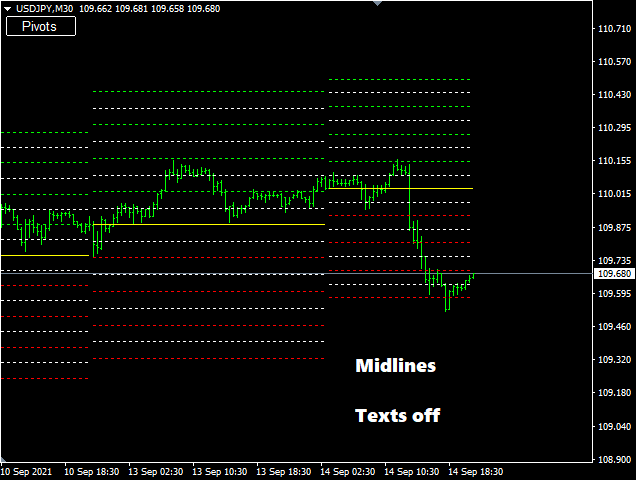
- Texts with prices and pip distances to central pivot/level
- Inputs for Camarilla/Fibonacci/ATR/Volatility levels
- Alerts, popup, push, email, sound, live or completed candles on level crossover
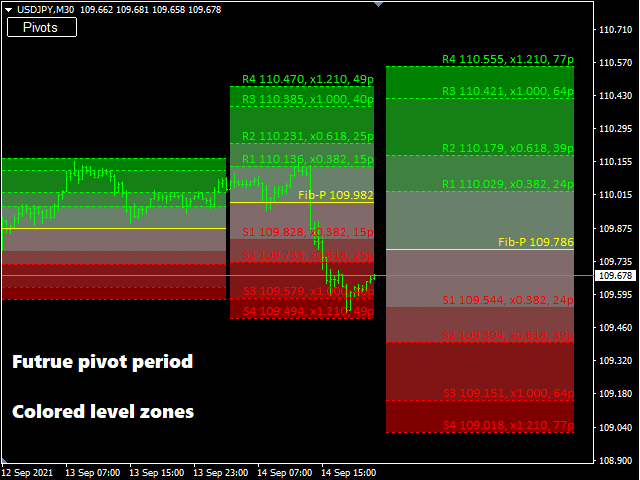
- Colored level zones, with color gradients
- Show/hide button
- Future pivot levels based on live time period
- Saturday/Sunday inclusion, Saturday included as end of week, Sunday included as start of week
Levels Note:
- ATR is taken with MTF data of selected timeframe, and levels as input perentages %.
- Historical volatility is taken as the previous close, +/- input multiples of standard deviation * previous close, based on Log returns: Ln(Close[0]/Close[1])
- Close volatility is taken as the previous close, +/- input multiples of standard deviation, based on Close prices
- If there are any issues or suggestions for the indicator, please comment and let me know. The feedback will be noted and considered in future updates.


Great Indicator!! Thanks. It plots Camarilla Levels correctly!