BWmfi Bar
- インディケータ
- Andrii Diachenko
- バージョン: 1.0
- アクティベーション: 10
The BWmfi Bar indicator is designed to work with the Bill Williams system
The indicator displays MFI signals on the chart, highlighting bars the corresponding MFI signals
You can choose 4 options for the indicator operation by setting the corresponding number 1,2,3,4 in the settings, in the "Input parameters" tab:
The indicator displays MFI signals on the chart, highlighting bars the corresponding MFI signals
You can choose 4 options for the indicator operation by setting the corresponding number 1,2,3,4 in the settings, in the "Input parameters" tab:
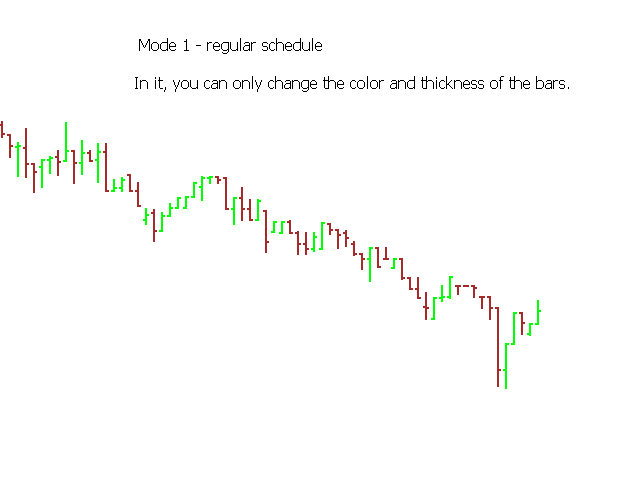
- Normal graph without MFI signals
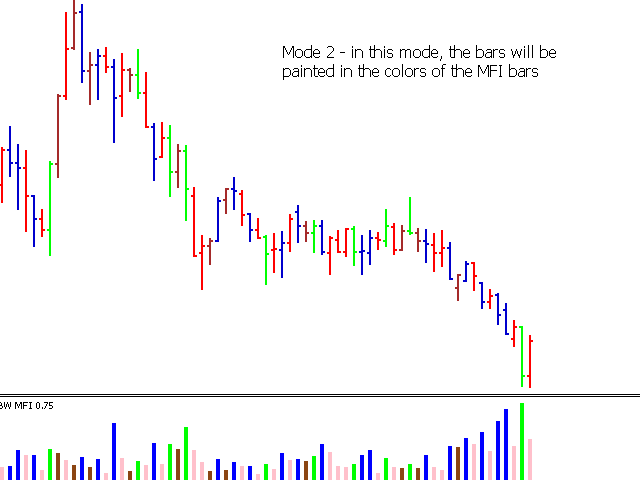
- In this mode, the bars will be painted in the colors of the MFI bars
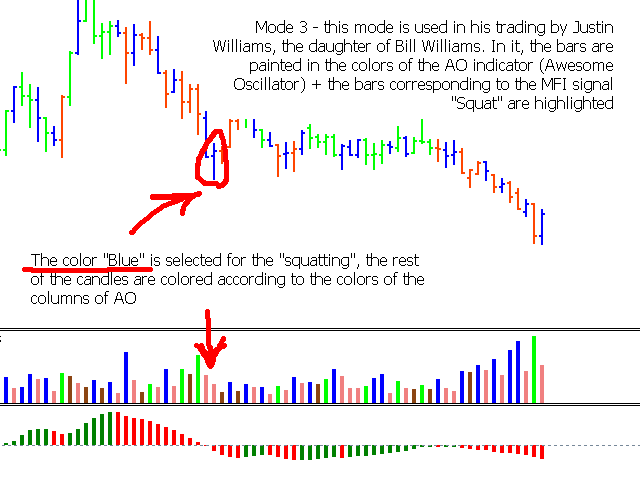
- This regime is used in his trading by Justin Williams, the daughter of Bill Williams. In it, the bars are painted in the colors of the AO indicator (Awesome Oscillator) + the bars corresponding to the "Squat" MFI signal are highlighted
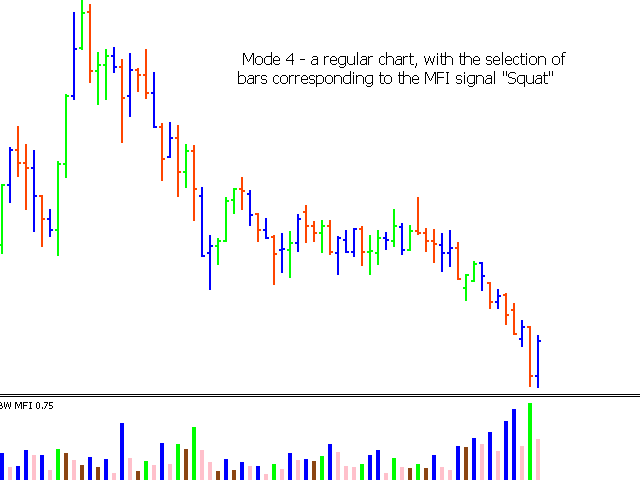
- A regular chart, with the highlighting of the bars corresponding to the MFI signal "Squat"
In the settings, in the "Colors" tab, you can set the color and thickness of the bars
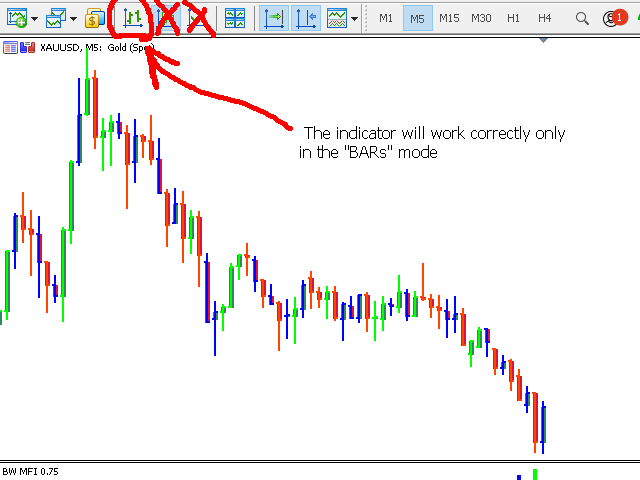
! - The indicator works only in BARs mode