Buy Sell Pressure
This indicator is a trend indicator.
It is based on moving averages. Very simple and very useful.
One thing to keep in mind is that it is a trend indicator, so it is better to use it when the market is trending.
Use on any pairs . It is not re paint indicator .
It should not be used in ranging markets .
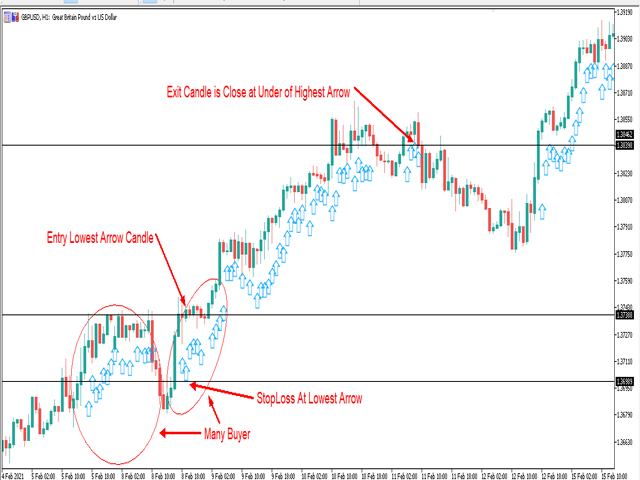
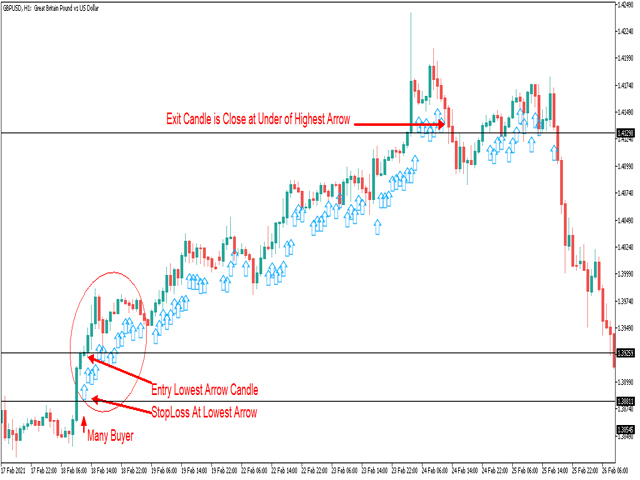
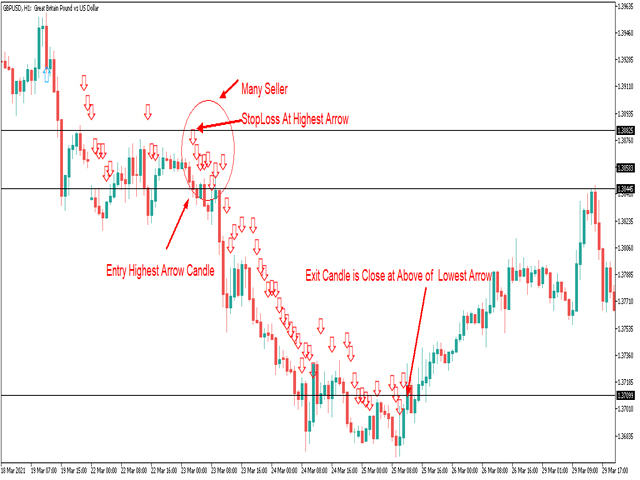
Stop Loss, Entry and Exit can also be used with this indicator.You can see how to use this indicator in the screenshots. More useful on M15, H1, H4 time frames. Thanks For All.
MT4 Version is Here
https://www.mql5.com/en/market/product/70831?source=Site+Profile+Seller