BeST Trend Scanner MT5
- インディケータ
- Eleni Koulocheri
- バージョン: 1.20
- アクティベーション: 10
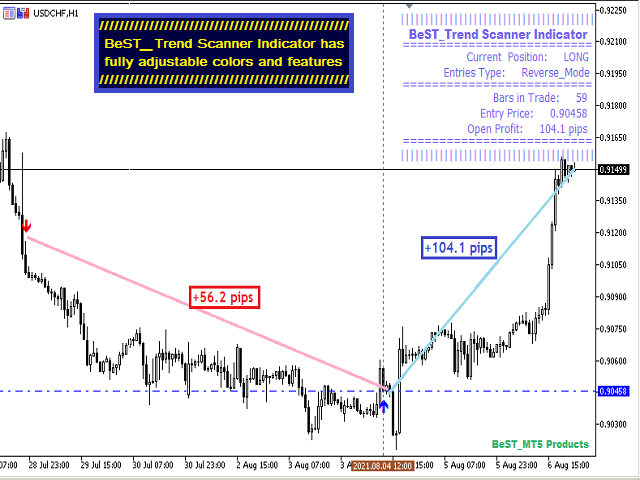
BeST_Trend Scanner is a very useful tool that defines in advance and with a high statistical percentage of accuracy the subsequent Resistance & Support Levels of the anticipated upside or downside trending move of price and so
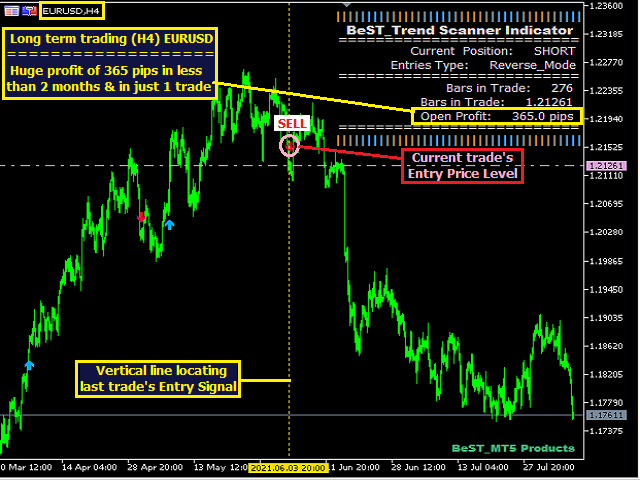
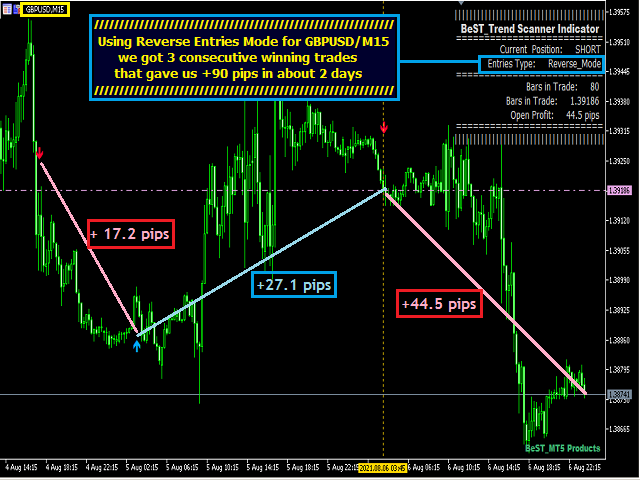
- When used at its Reverse Entries Mode:
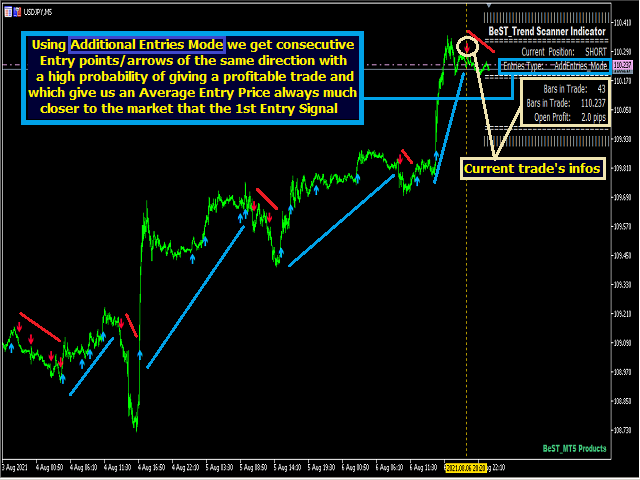
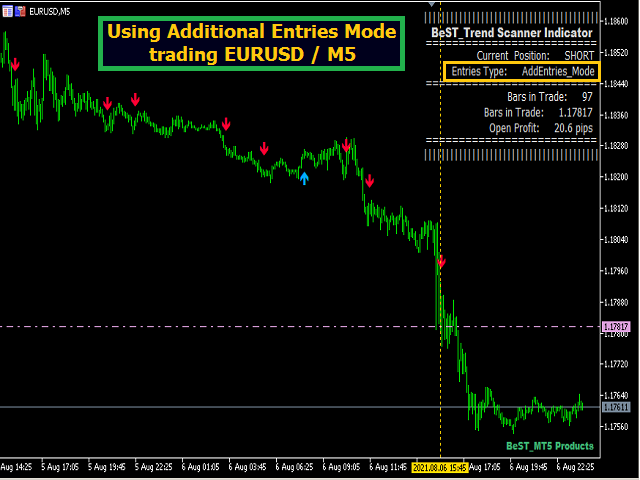
It generates Buy or Sell arrows at the very beginning of an Uptrend or Downtrend respectively when used at its Reverse Entries Mode while also - When used at its Additional Entries Mode:
It generates Buy or Sell arrows of the same direction during the development of the corresponding trend at high winning probability Entry points
Additionally the indicator also sends immediately with every Entry Signal an Alert Message through MT5, Mobile and Email push and so in this way it offers the chance for daily trading with favorable probability.
It is also important to note that this particular tool it deals mainly with the identification of appropriate points of Entry into the market. So it is necessary the parallel use of a good Exit Strategy (for example using Mov.Average, CCI, MACD,BeST_Profit Taker Exits Indicator, etc. along with an appropriate Risk and Money Management method (using SL,TP,Trailing Stop,Time Stop,…).
BeST_Trend Scanner MT5 Indicator
- Draws definite Buy/Sell Arrows
- Draws always only after the bar closing and so is non-repainting and non-backpainting
- Displays a real-time updated Info Panel
- Implements all MT5 Alerts for all the Entry Signals
Filtering Entry Signals
We can use the indicator at the H1 and M30 timeframes in order to determine the trend (both must give the same Signal) and after this we can wait for the same signal in M15 timeframe to enter the trade.
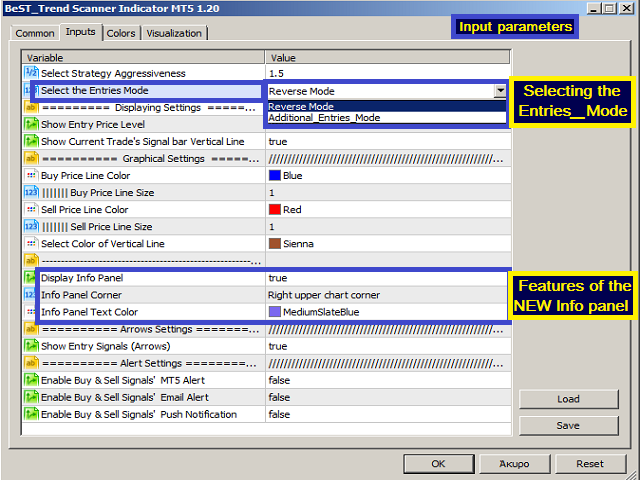
Inputs
Basic Settings
- Select Strategy Aggressiveness - for selecting through a multiplier factor the aggressiveness of the underlying strategy meaning the number of Entry Arrows produced.
- Select the Entries Mode – for selecting Reverse or Additional Entries Mode
Graphical Settings – for controlling the colors of Cchart Objects and the Panel features
Arrows Settings - for controlling Entry arrows display
Alert Settings - for controlling the use of MT5 Alerts for Entry points
For EA Developers
- Buy Arrows: Buffer = 1
- Sell Arrows: Buffer = 0