Round Level MT5
- インディケータ
- Szymon Palczynski
- バージョン: 1.10
The fact that round number levels have a significant influence on the market cannot be denied and should not be overlooked. These psychological levels are used by both retail Forex traders and major banks that deal in Forex. Very simple and effective indicator and most importantly free.
//////////////////////////////////////////////////////////////////////////////////////////////////////////////////////////////////////////////////////////////
The program does not work in the strategy tester.
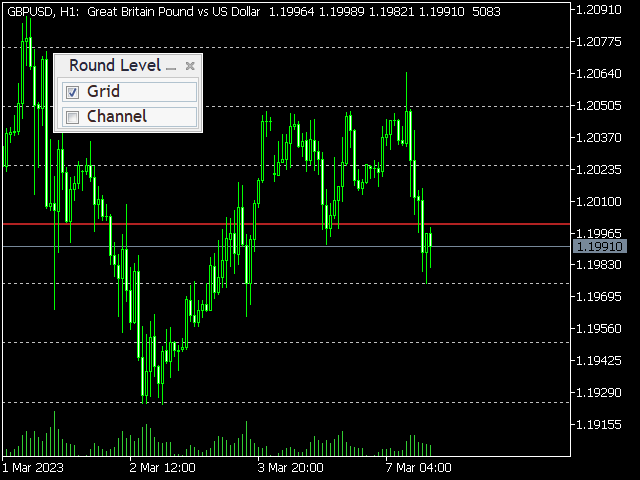
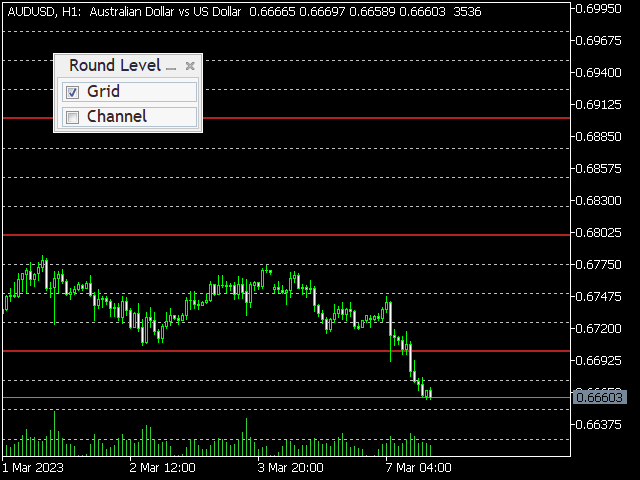


Thank you for this indicator, simple and effective. The only drawback is that I have difficulties unchecking the grid box, and when changing the timeframe, the lines get deleted. It would be nice if the lines could persist even when switching timeframes.
Update: to uncheck just click on the text, this works better than clicking the checkboxes