Range Exhaustion MT5
- インディケータ
- Robert Gerald Wood
- バージョン: 1.0
- アクティベーション: 10
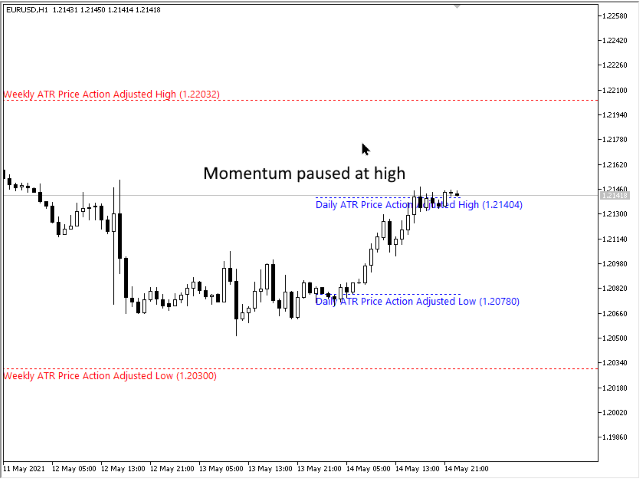
範囲の枯渇は、価格が現在の期間の予想される範囲を満たすか超えると発生します。これらのレベルでは、価格は期間の初期に比べて勢いを失い始めるため、新しいポジションをとっていないことを確認するのに良いポイントです.
このインジケーターは、チャート上でこれが発生する可能性が高い場所を示し、日次、週次、月次の期間のレベルを示します。
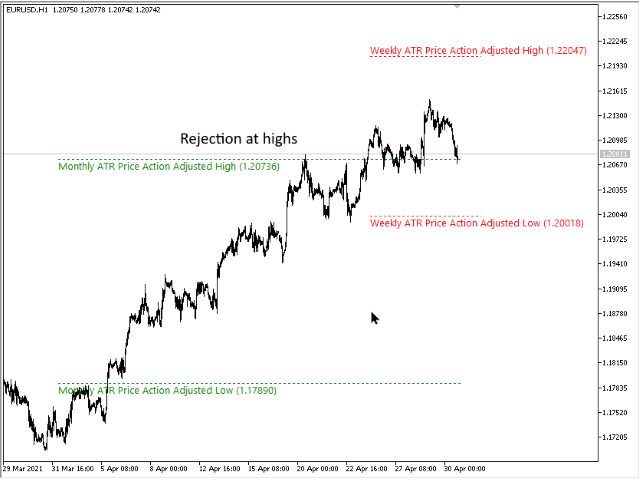
価格がこれらの枯渇レベルを超えている場合は、動きの背後にある勢いが非常に強く、より高い時間枠レベルに向かっている可能性が高いことを示しています.
インジケーターは、好みに応じて、Average True Range (ATR) または Average Range (ADR) 計算を使用できます。デフォルトでは、外国為替チャートでよりうまく機能することがわかっているため、ATR を使用しますが、ADR は株式ベースのインデックスとシンボルで優位に立っています。
インジケーターには、以下で説明するいくつかの描画モードがあり、ニーズに合わせて調整できます。
設定
計算モード
レベルの計算には、AverageTrueRange (ATR) または AverageDailyRange (ADR) から選択します。
描画モード
インジケーターはさまざまな方法で表示できます。
- 価格調整ラインを引く - レベルは、到達した高値と安値に基づいて、期間を通じて調整されます。これがデフォルトで、最も一般的に使用される方法です。
- 期待される最大値を描画します - レベルは固定値であり、最終期間の終値に ATR または ADR 値をプラスまたはマイナスしたものです。
- 両方の線を引く - 上記の両方の行を表示します。
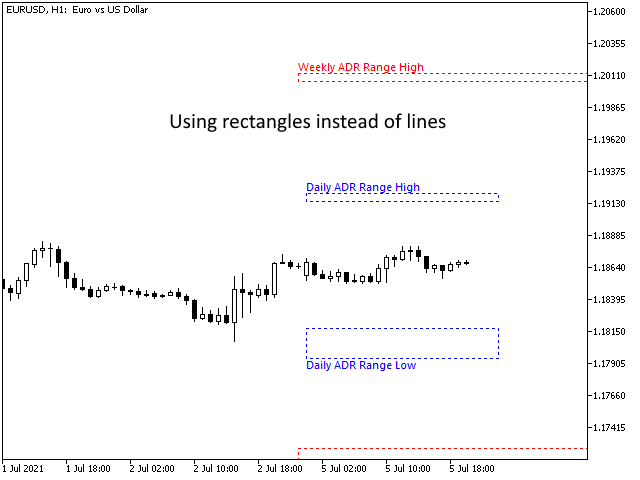
- 長方形を描く - 上と下の線が調整済みの価格と予想される最大/最小である単一の長方形を示します
再検討期間
ATR/ADR 値を計算するときに使用する期間。
ShowDailyLimits
true の場合、毎日の疲労度を描画します。
ShowWeeklyLimits
true の場合、週ごとの疲労度を描画します。
ShowMonthlyLimits
true の場合、毎月の疲労レベルを描画します。
説明を表示
true の場合、レベルの説明ラベルを描画します。 false の場合、線だけが描画されますが、線が何を表しているかを知る必要がある場合は、線にツールチップが表示されます。
ShowPriceInDescription
true の場合、レベル値が説明とツールチップに追加されます。
説明フォントサイズ
説明を描画するときに使用するフォント サイズ
延長線
true の場合、期間の終わりまで線を引く代わりに、線はチャートの右側に無限に伸びます。
D1、W1、および MN1 の各期間について、次の設定が表示されます。
XX_色
線と説明を描くときに使用する色
XX_LineWidth
描画する線の幅。 LineStyle が Solid 以外の場合、この値は無視されます。実線のみが MetaTrader で幅を持つことができます。
XX_LineStyle
標準選択から描画する線のタイプ。