Ultra ZigZag
- インディケータ
- Fabio Luis Pretti
- バージョン: 1.1
- アップデート済み: 6 7月 2021
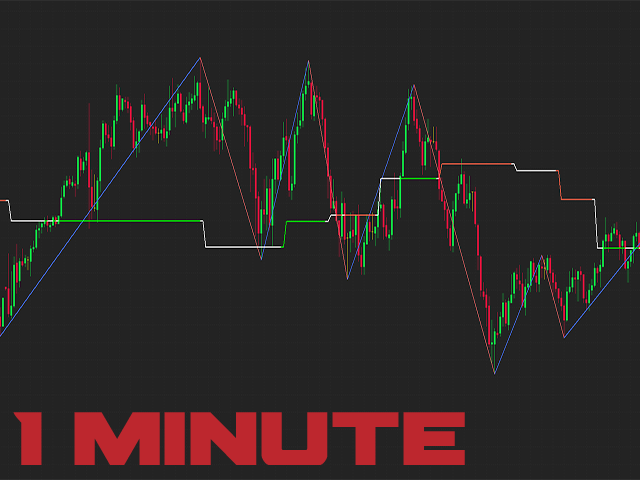
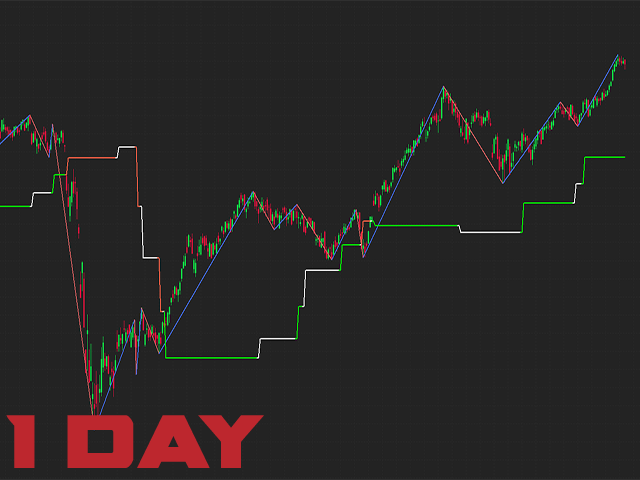
▸ Simple indicator used in technical strategies to analyze tops, bottoms and reversal or continuation points.
Developer information:
▸ Line values and colors:
Buffer 0: ZigZag line value;
Buffer 1: ZigZag color value;
Buffer 2: Median line value;
Buffer 3: Median color value;
▸ Buffer to get the values of each top and bottom.
Buffer 4: Top value;Buffer 5: Bottoms value;
▸ Buffer that returns the type of the last direction.
Buffer 9: 0= Not updated, 1= High, -1= Low;
This indicator is compatible with ScriptBot expert, automate your strategy with ease.

muy bueno