TriggerArrow
- インディケータ
- Christopher Cyril Abu Aita
- バージョン: 1.1
- アクティベーション: 5
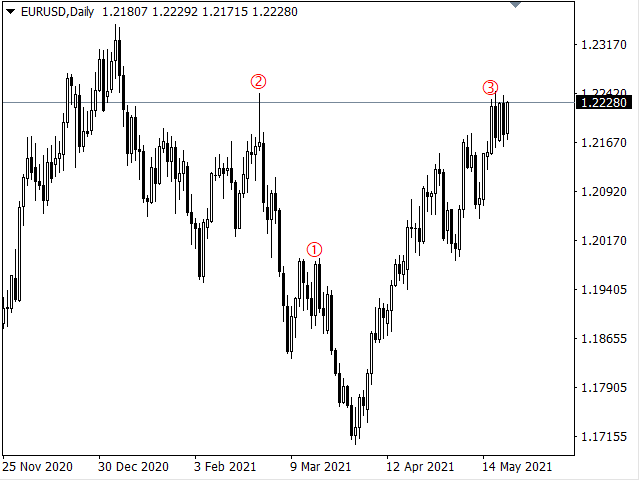
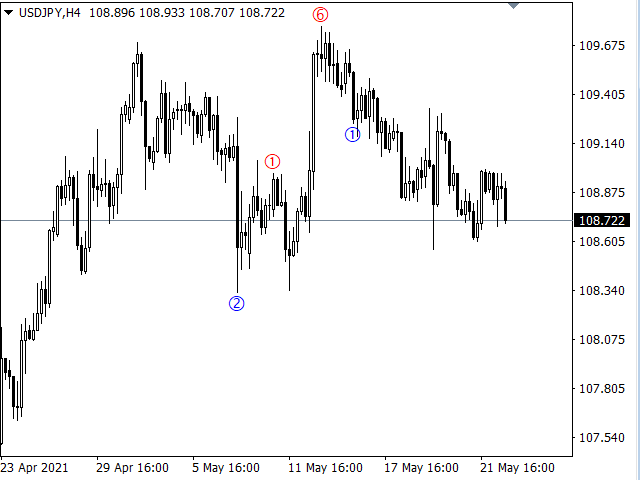
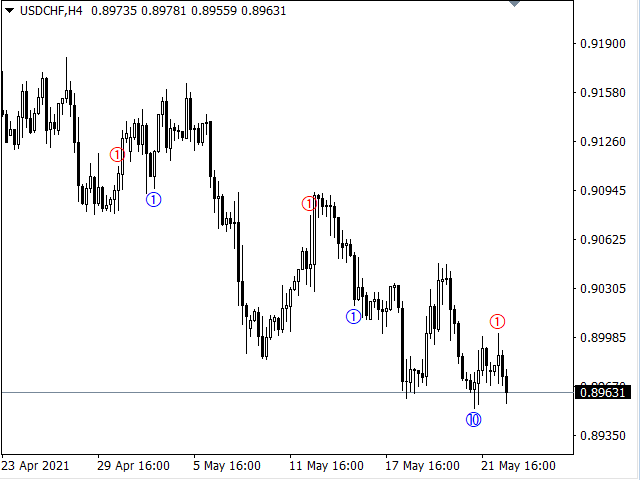
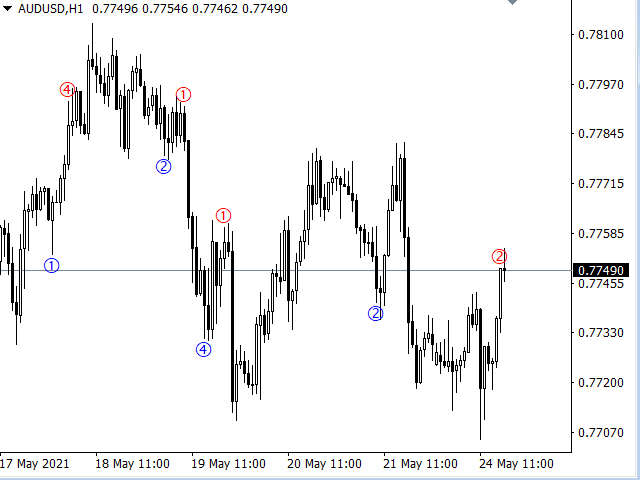
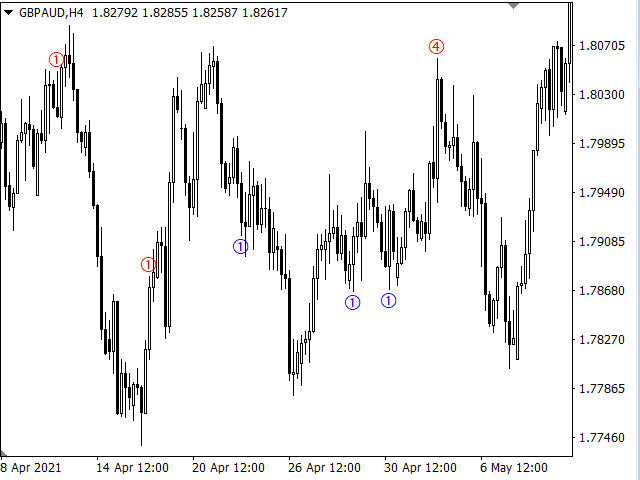
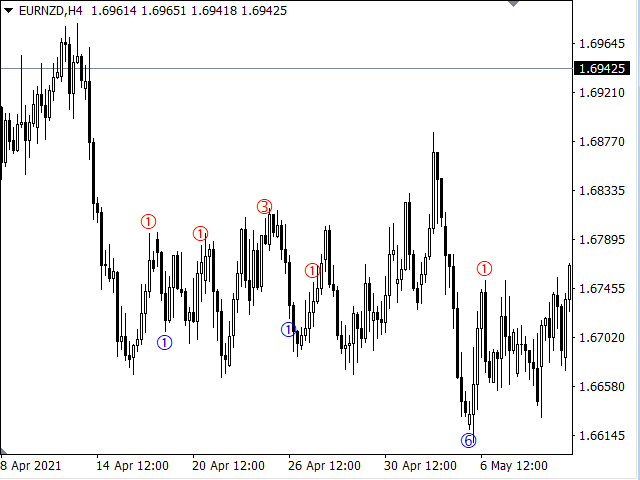
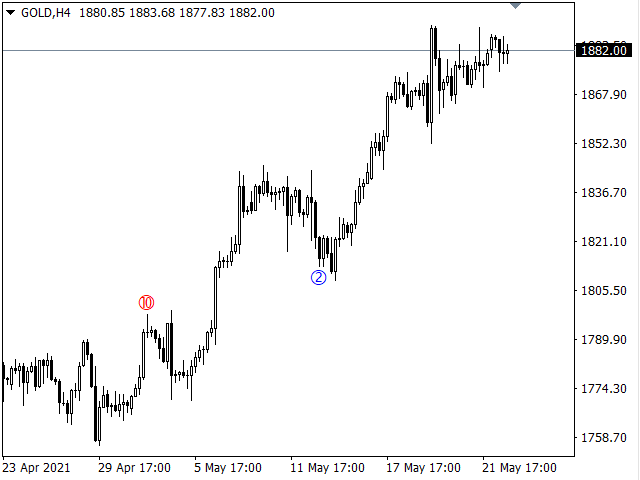
It's a DYNAMIC PERIOD indicator which identifies best ENTRY PRICE in the direction of main trend. It's completely non-repaint indicator and very simple to use.
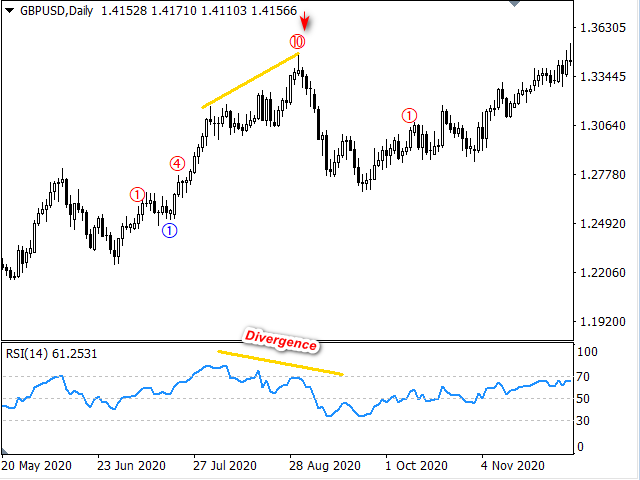
Each arrow has a specific impact value from 1 to 10. Basically there is no important difference between impact numbers. The main point is: A higher impact value means that signal is generated from a bigger swing.
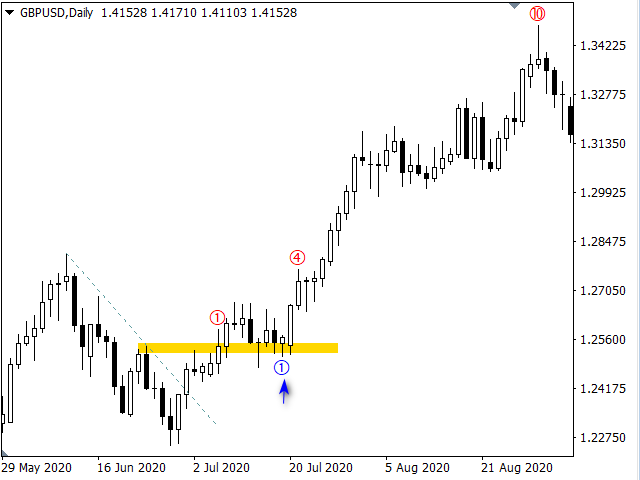
When it draws a Buy arrow on a bottom, It means that we had a Trend, A correction, And now this bottom is a reliable trigger for buy trade in the direction of main trend. And Vice Versa for Sell trends.
Key Features of Trigger Arrow:
- Doesn't repaint
- Identifies the best Trigger
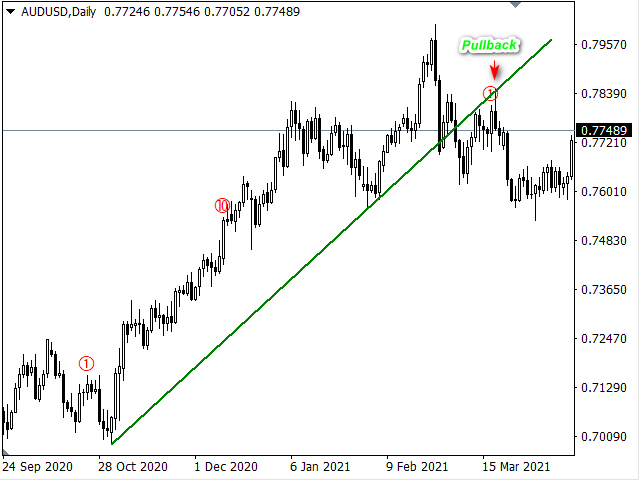
- Useful for Trend Trading and Swing Trading
- Powerful in Up-Trends, Down-Trends and Non-Trend situations
- Works on any Assets and Time-Frame
- Suggests best entry price to reduce risk
- Very simple and easy to use
- Sends Alerts, Emails and Push Notifications
- The Sensitivity parameter helps trader to compatible it with his/her own trading type
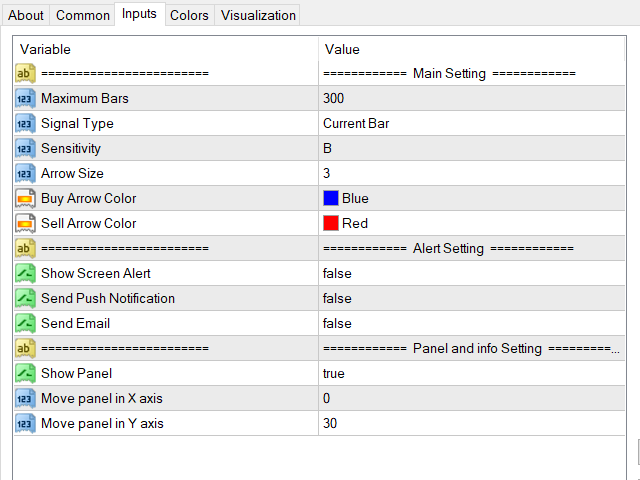
Parameters:
- Maximum Bars : Maximum candles to draw arrows. This parameter won't change the results of calculations. Just decrease the calculation time
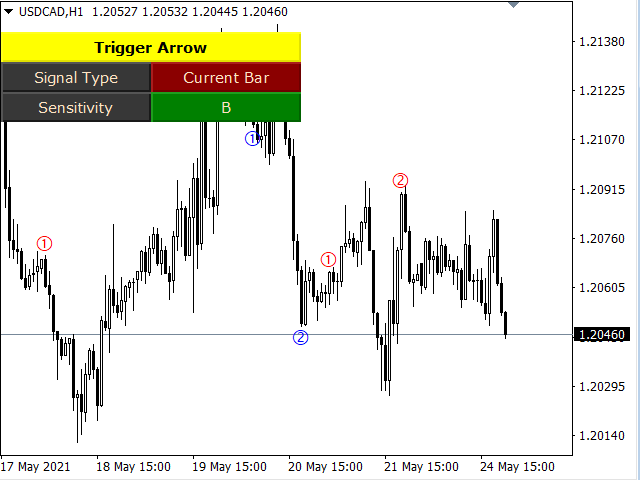
- Signal Type : "Current Bar" means: The last signal will be generated before last candle is closed. And "Confirmed Bar" means: the last signal will be generated after last candle closed.
- Sensitivity: You can set the Sensitivity from A to C. A means the lowest Sensitivity and C means the highest. I myself prefer the B that is medium one
- Arrow Size : Size of Arrows
- Buy Arrow Color : Color of Buy arrows
- Sell Arrow Color : Color of Sell arrows
(Changeable on the Panel)
(Changeable on the Panel)
- Show Screen Alert : Shows screen alert if an arrow appears
- Send Push Notification : Sends a push notification if an arrow appears
- Send Email : Sends an Email if an arrow appears
Panel and info Setting:
- Move panel in X axis : Moving Panel in X axis of chart
- Move panel in Y axis : Moving Panel in Y axis of chart