Time Session OHLC Mt5
- インディケータ
- Hiren Parekh
- バージョン: 1.0
Time Session OPEN-HIGH-LOW-CLOSE
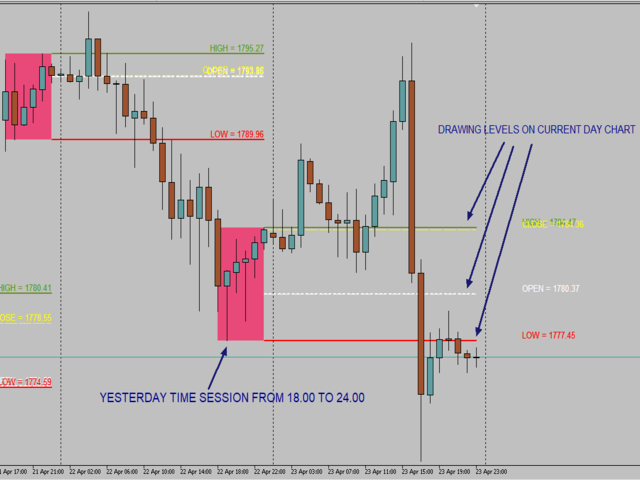
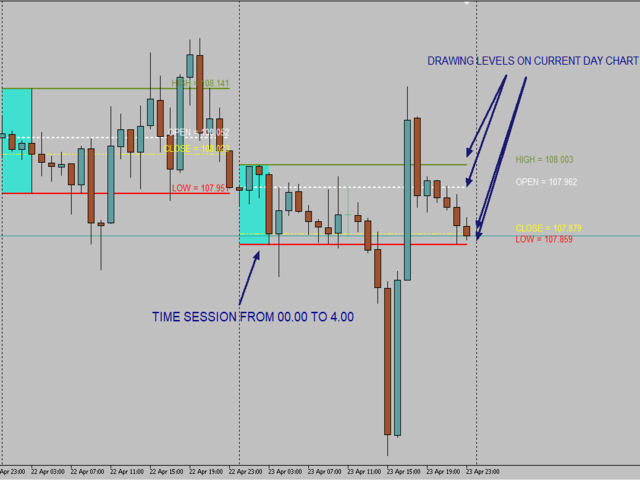
This Indicator Will Draw Lines Of OHLC Levels Of Time Session Defined By User.
It Will Plot Floating Lines On Current Day Chart.
Time Session Can Of Current Day Or Previous Day.
You Can Plot Multiple Session Lines By Giving Unique ID To Each Session.
It Can Even Show Historical Levels Of Time Session Selected By User On Chart To Do Backdating Test.
You Can Write Text To Describe The Lines.


Good indicator, gives you the parameters of the start of the day. It works id using it in conjunction of your trading system. Thank you for providing this.