Furia
- インディケータ
- Osaeldi Honorato De Jesus
- バージョン: 1.0
- アクティベーション: 5
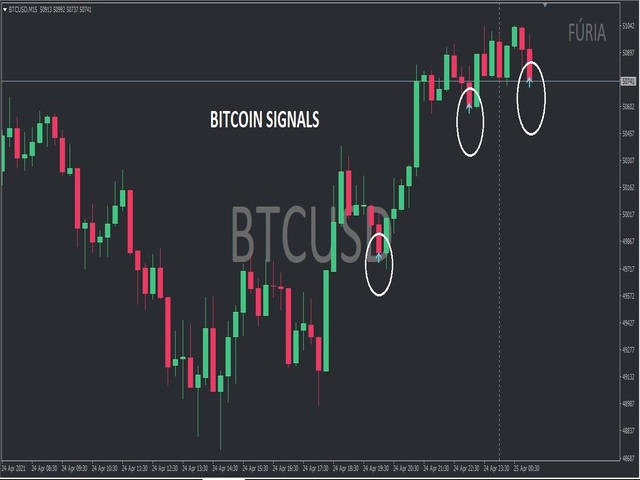
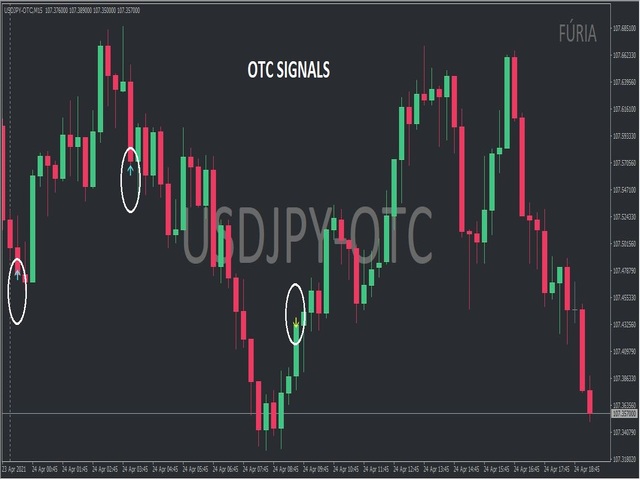
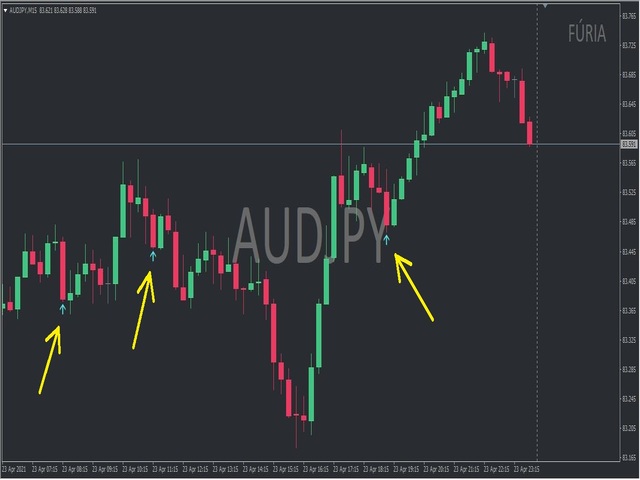
The Fúria indicator was developed to work when the market is in trend, that is, you will rarely see any signs in consolidation zones. It can be used for both Forex and Binary Options.
The signs plotted on the graph do not repaint or recalculate, even if you close and reopen your MT4 / MT5 they will be there.
Wait for the signal to set on the candle before you can enter the next candle.
==================================================
* BUFFERS: 0 (CALL) and 1 (PUT);
* TYPE OF ENTRY: next candle;
* EXPIRATION: end of the candle;
* RECOVERY: 1 Martingale (recommended);
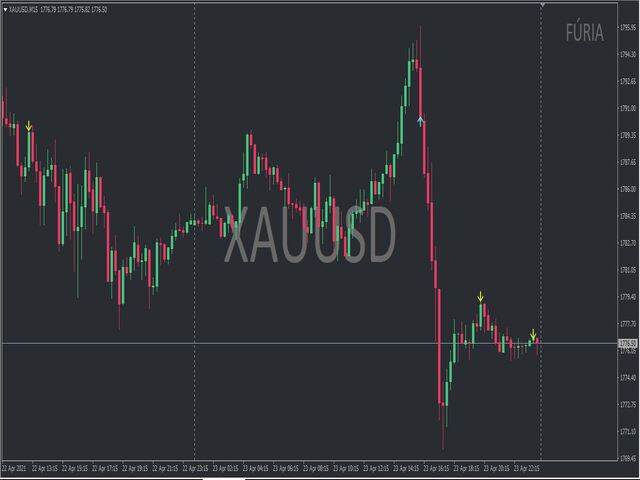
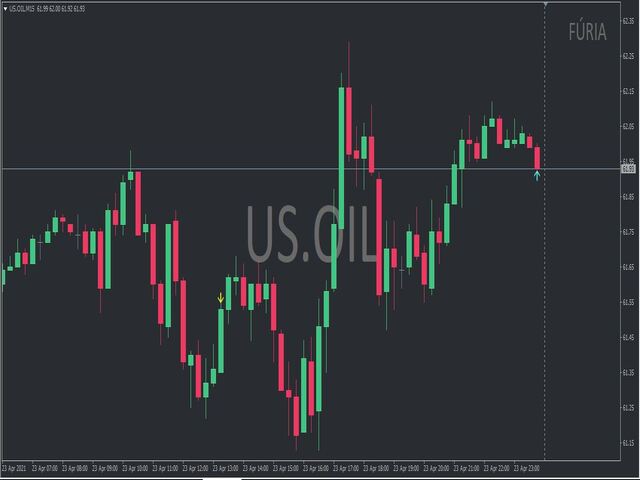
* GRAPHIC TIME: all. But I especially recommend M15 (M5 for those "in a hurry" - use with caution!)
* ASSETS: all;
* HOURS: from 00:00 to 15:00 (avoid operating at times when there is little volume / movement on the graph);
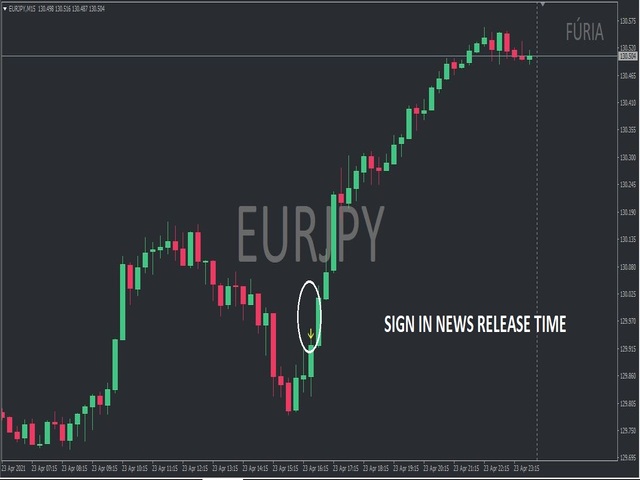
* NEWS: do not operate at times when news is published. See the Investing website.
==================================================
FINAL CONSIDERATIONS
This indicator was developed with the purpose of being profitable and not perfect! So you will not get 100% of the transactions right, this is impossible !.
When placing it on the chart, check the past candlesticks (not all, of course!) If the assertiveness in that asset and timing is good. Switch between graphical assets and times to find the most assertive ones.
Respect your management always. Hit the goal, get out!
==================================================
LEARN MORE
+ Don't be rushed, bridges are not built overnight.
+ Shortcuts to success can lead to failure.
==================================================