Multi Pivot Free
One of the simplest Pivot Point indicator, easy to operate, and most complete for a single chart in determining Resistance and Support level lines.
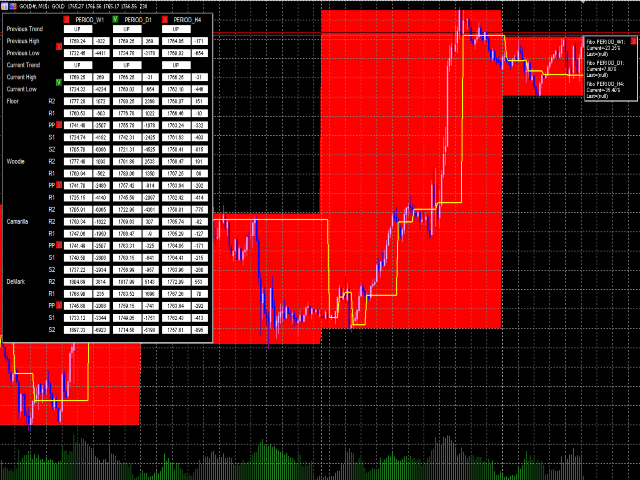
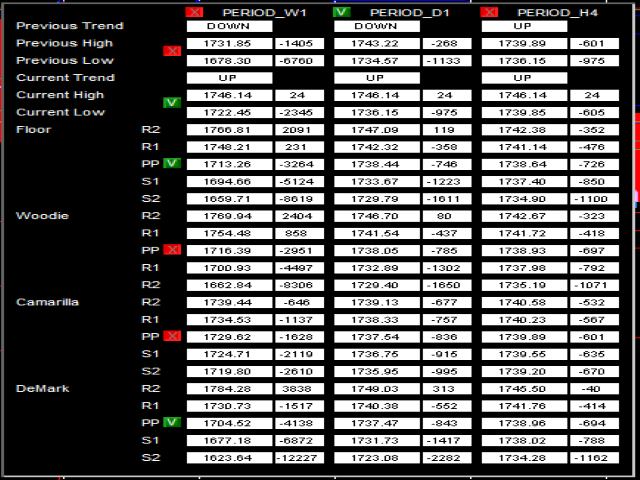
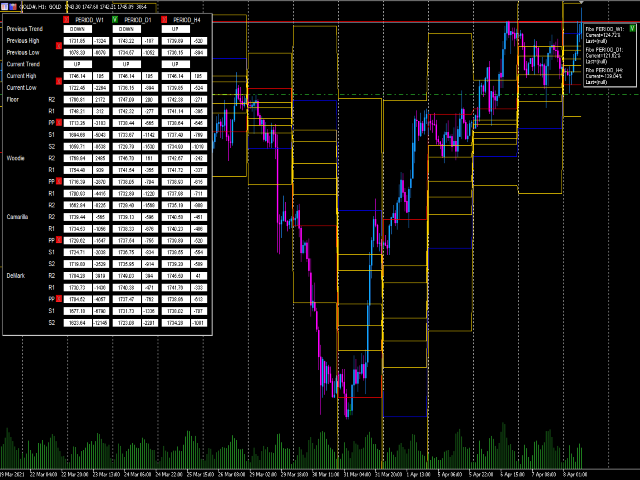
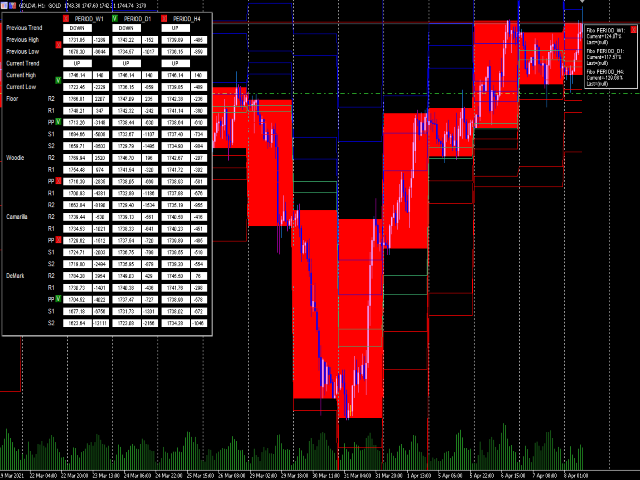
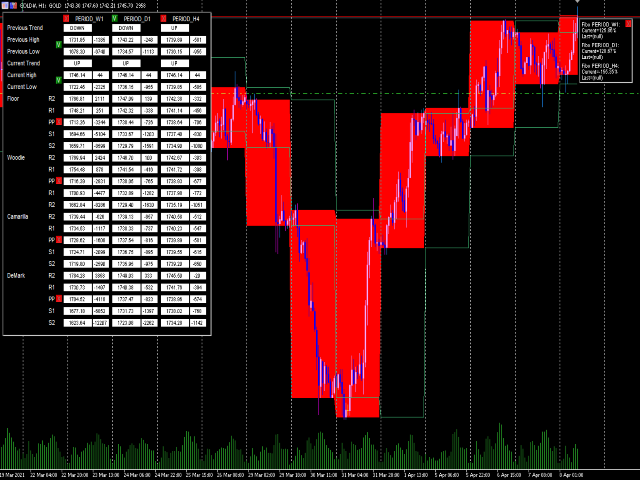
In single chart, it will show R&S Level Line with 5 popular types of Pivot Point, Highest&Lowest of closing price Include the Trend and up to 3 Time Frames.
Five types (Floor, Woodie, Camarilla, DeMark, & Fibonacci) of popular Pivot Points in determining Resistance and Support levels.
With just using simple button on the chart, you can display some or all types of Pivot points, Resistance and Support levels as you like.
Signal line to make easier to read the High Low close price pattern. (I'm usually using 15M timeframes for the chart and 1Day for the indicator)
Get a Notification that the price crosses the line Up or Down.
This is only work with EURUSD, to use it for All Currency Pairs, Cryptocurrencies, and Stocks.
Use this version: https://www.mql5.com/en/market/product/65127
To works with selected Timeframes, please update the history of the Timeframes by select the periods (M5, M15, M30, H1, etc.) on the chart first. (There will be future update for this, so it can automatically update the history)
If there's any others problem, you can just send me a message.
Chart Utility:
- Buttons to show the Pivot line on the Chart (Can show multiple pivot line)
- Buttons to choose the Timeframe of the Pivot line on the Chart
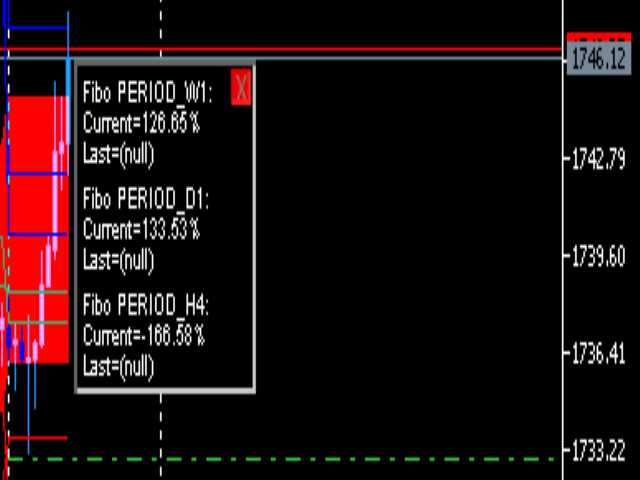
- Fibonacci mini panel to show the detail of the current percentage position
- Price of each Pivot and Timeframes (you can just copy the value and paste it to make an order)
- Gaps Points of Pivot price and Current price (you can just copy the value and paste it to make an order)
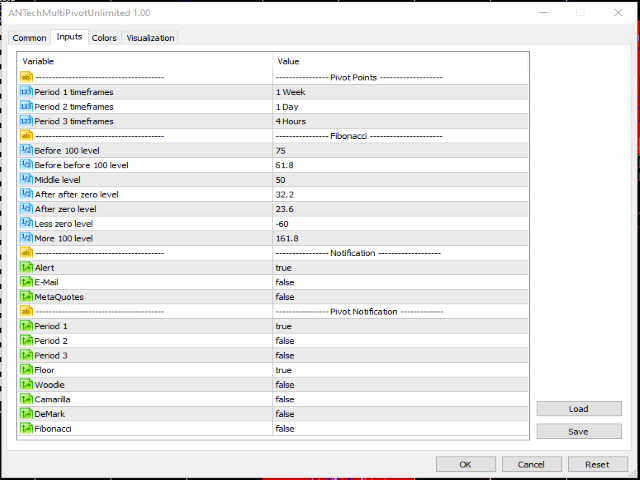
Inputs:
- Period 1 timeframes
- Period 2 timeframes
- Period 3 timeframes
- Fibonacci More100, Before100, BeforeBefore100, Middle, AfterAfterZero, AfterZero, and LessZero Level percentage
- Alert (Enable Alert notification)
- Email (Enable Email notification)
- MetaQuotes (Enable MetaQuotes notification, you can get a notification from mobile device)
- Enable Period 1, Period 2, and Period 3 notification
- Enable Floor, Woodie, Camarilla, DeMark, and Fibonacci notification
- Color Line and Type for each Pivot