• 概要
  • レビュー (1)
  • コメント (8)
  • 最新情報

MR Range Breakouts 4

5
" A trading range occurs when a financial instrument trades between constant high and low prices over a period of time. The upper part of the trading range of a financial instrument often provides price resistance, while the lower part of the trading range usually offers price support.  Traders can enter in the direction of a breakout or breakdown from a trading range... "

This is the "Classical Theory" understanding of ranges. We have a different understanding of the nature of ranges and the processes that occur within them. Therefore, we at "Masters of Risk" created our indicator to cover all our requirements. "MR Range Breakouts" indicator was created from scratch by us according to the author's methodology. It is based on the concept of "Auction Market Theory" developed by J. Peter Steidlmayer and "Locked-in Range" market analysis method developed by Tom Leksey. Both concepts largely overlap with our understanding of the processes in the "Range" and show how market participants interact. Since there is no established terminology for ranges in the "Classical Theory" we will use our own terminology!!!

To give you some idea, we will briefly introduce the processes that take place in the range:
1. When we have two extremes and the price has tested at least 75% of the distance between them in the form of a corrective movement, we say that a “Balance” has been established between buyers and sellers. Usually, the intentions to achieve a "Balance" of prices are known only by the "Big" players in the markets. If the price continues or makes a new impulse, renews one of the extremes and does not return to them again in the form of a correction, we say that the "Balance" is broken and we now have an "Imbalance".
2. If, after reaching a "Balance" between buyers and sellers, the price continues to move between two price extremes, we say that a "Range" has developed between the two price extremes. Here, along with the "Big" market players, the "Professional" traders also enter positions.
3. When the prices remain in the "Range" for a longer time, this "Range" is also seen (perceived) by the "Non-professional" market participants. Usually their stop-losses are placed above or below the boundaries of the "Range". This is where we say we have an "Open Range" because all market participants can actively enter positions and trade the distance between the two extremes that define the upper and lower boundaries of the "Range."
4. When enough participants accumulate in the "Range" with their stop-losses, some of the "Big" players try to close the "Range" of the prices by exiting it at the expense of these stop-losses. If they succeed and then there is a "correction" beyond the "Range", we say that the "Open Range" is locked by these "Big" players and we have a "Range of Buyers" or a "Range of Sellers".
5. If another portion of the "Big" players decide they don't like it and return the price to the "Range" and test a minimum of 75% of the distance between the two extremes that define the boundaries of the "Range", then we say we have an "Extending" of the boundaries of the "Open Range". In this case, the distance between the upper and lower boundaries of the "Open Range" is updated and a new range test distance of 75% is determined.
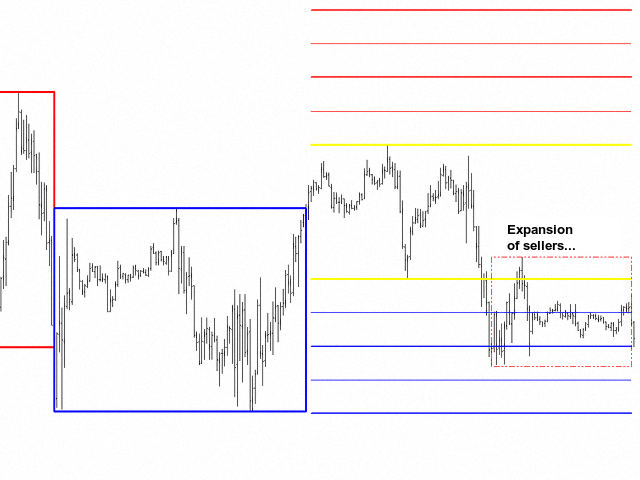
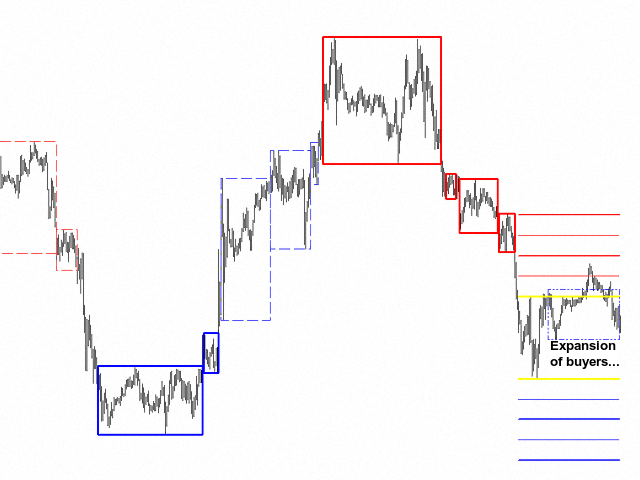
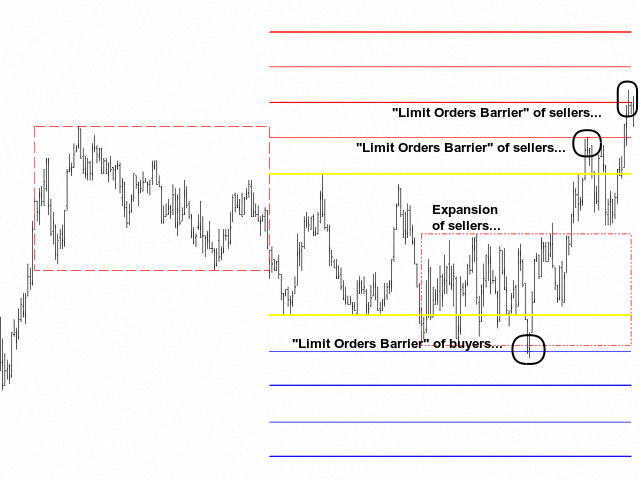
6. If these “Big” players fail to return the price to at least 75% after exiting the range, then we say that there is a struggle for dominance of different groups of "Big" players. This usually happens at the upper or lower boundaries of the "Open Range" and between the "Limit Orders Barriers". Then we say that we have an "Expansion" of sellers or an "Expansion" of buyers.
7. According to our experience with the indicator, the best places to enter a position are in the "Limit Order Barriers" area in the direction of the trend. For example, if we have a downtrend, we are looking for a sell entry in the "Limit Orders Barriers" area of sellers, and accordingly, if we have an uptrend, we are looking for a buy entry in the "Limit Orders Barriers" area of buyers. Of course, all our decisions must be confirmed by other indicators in these zones.

What the indicator shows:
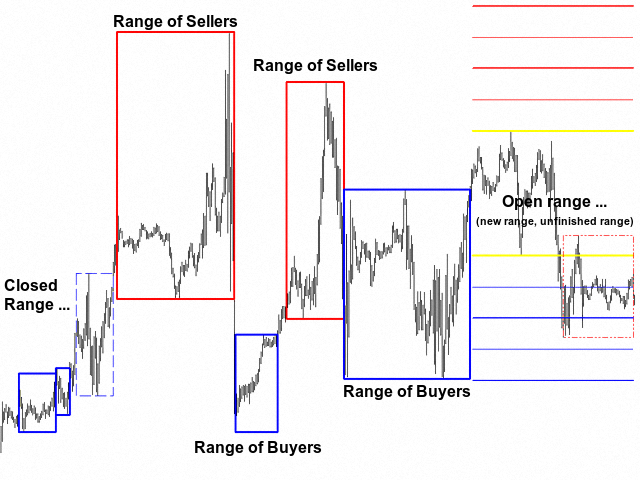
  • "Red" rectangles show "Ranges of Sellers", where buyers remain in "Locked-in Range", and sellers win. If you place a volume profile in "Range of Sellers", in the area below the "POC" volume there are buyers locked in range".
  • "Blue" rectangles show "Ranges of Buyers", where sellers remain in "Locked-in Range", and buyers win. If you place a volume profile in "Range of Buyers", in the area above the "POC" volume there are sellers locked in range".
  • "Dashed" rectangles show closed "Ranges" - the places where the price absorbed the volumes in the Ranges.
  • "Yellow" lines show the upper and lower boundaries of the "Open Range" - it is not yet determined whether this will be a range of buyers or sellers. "Open Range" is a new and not yet finished range. In it, positions are recruited for the "Big" players, there is a struggle for initiative between the "Big" players, various tools are used in the confrontation between them. Unfortunately, this is also the place where "non-professional" market participants lose their money, because they don't understand the processes that go on in the range...
  • "Blue (dash dot dot)" rectangle indicates the beginning of the buyers "Еxpansion" initiative. It shows the struggle between the "Big" players in the market, the potential expansion of the "Open Range" boundary or the possible formation of a new "Open range".
  • "Red (dash dot dot)" rectangle indicates the beginning of the sellers "Еxpansion" initiative. It shows the struggle between the "Big" players in the market, the potential expansion of the "Open Range" boundary or the possible formation of a new "Open range".
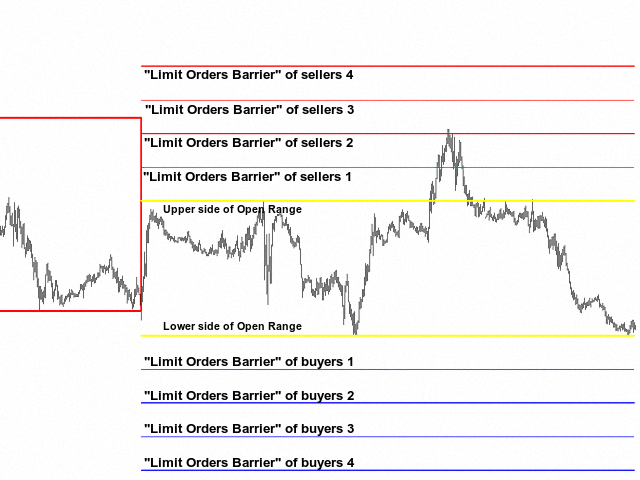
  • "Red" lines above the "Open Range" indicate the possible areas of "Limit Orders Barriers" of sellers.
  • "Blue" lines below the "Open Range" indicate the possible areas of "Limit Orders Barriers" of buyers.
"Limit Orders Barrier is a structure that is designed to restrict price movement in any direction by constantly placing limit orders against the movement. Typically observed above and below accumulation (range, balance)."
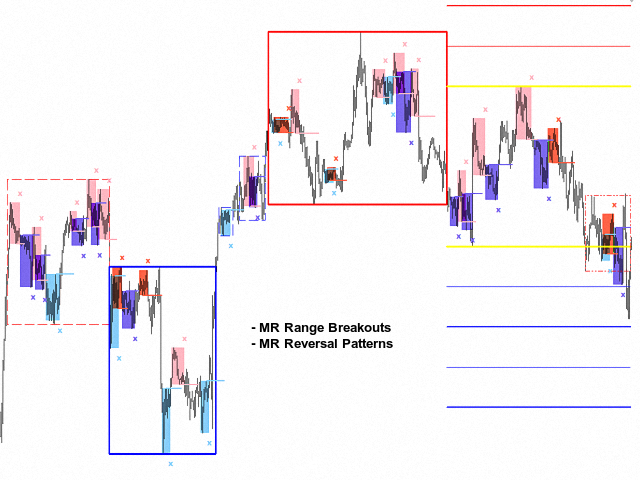
        • In combination with the "MR Reversal Patterns" indicator, you can see how buyers and sellers are distributed in the "Range". Since every trader waits for confirmation that their market entry is correct, the appearance of "Reversal Patterns" in the "Range" forms the accumulation of the open positions in a place, that we define as a "Point of Control" in the Volume Profile of the Range ". During the movement of the price in a trend, you can see how "Balances" are formed according to the "Auction Market Theory".
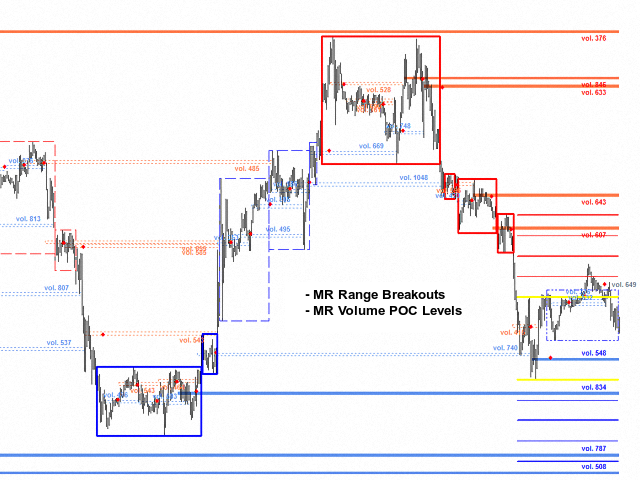
        • In combination with the "MR Volume POC Levels" indicator, you can see where important volumes are left after the exit from the "Balances" and "Ranges". In addition, you can see how the volumes are absorbed in the "Range" and accumulate positions of buyers and sellers.
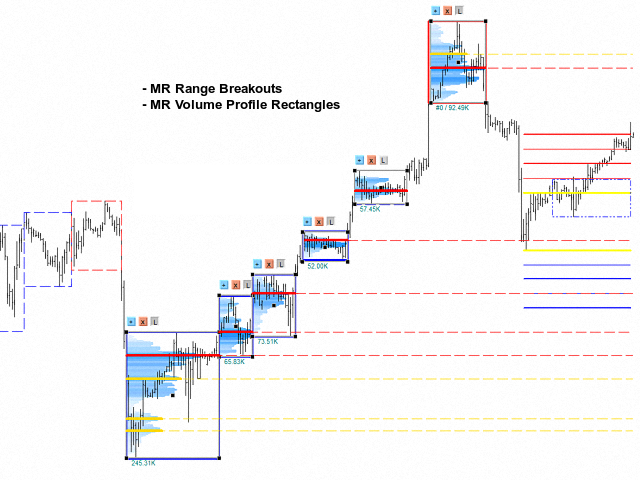
          • In combination with the "MR Volume Profile Rectangles" indicator, you can see where the places with the highest concentration of the open positions. In "Range of Sellers", buyers remain in "Locked-in Range" - in the area below "POC" volume, while in "Range of Buyers", sellers remain in "Locked-in Range" - in the area above "POC" volume.
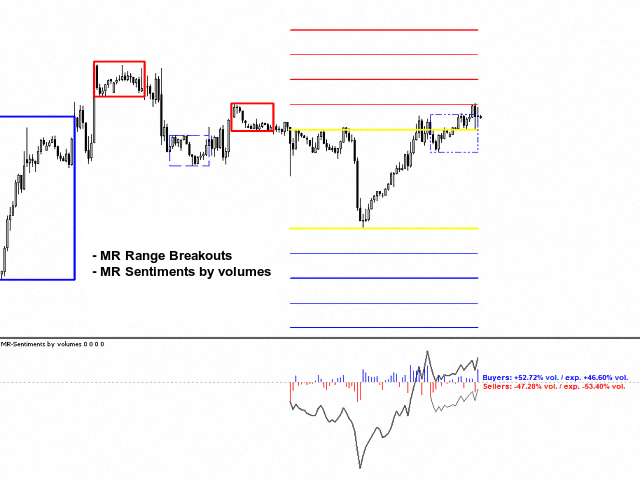
          • In combination with the "MR Sentiments by volumes" indicator, you can see the "Sentiments" inside the range. When we also have an "Expansion" of the sellers or the buyers, you can see the imbalance of all participants in the range to those in the "Expansion".
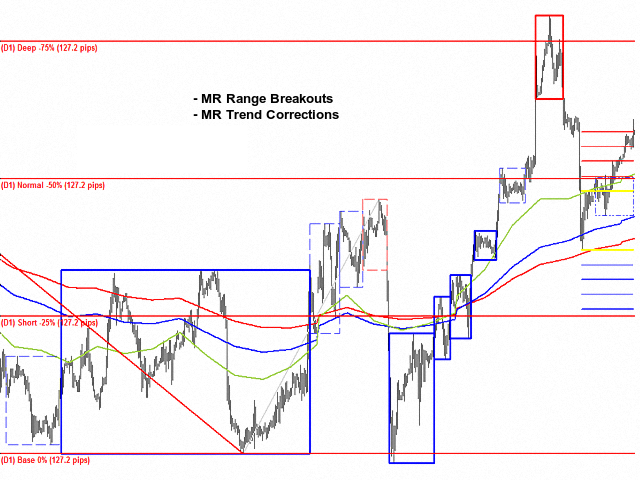
          • In combination with the "MR Trend Corrections" indicator, you can track the places where the volumes accumulate in the "Balances" and "Ranges" along the trend. Then the volumes of these places are absorbed in the "Correction" movements.


          Note:

          The indicator synchronizes the data from the time frames on which it works. Please wait a few seconds when needed...
          There may be slight differences between the figures, that are drawn on the chart of the time frame, that you selected in the indicator settings and the figures, that are drawn on the chart of the smaller time frames. This is related to the decomposition of the bar from the selected time frame to the smaller time frames. The bar of the selected time frame has a different structure of the smaller time frames. This is not a mistake!!! This is the option we have adopted to correctly determine the inputs and outputs of the ranges.

          If you liked the indicator, please support our work by giving 5 stars!!!


          For MetaTrader 5 https://www.mql5.com/en/market/product/63487
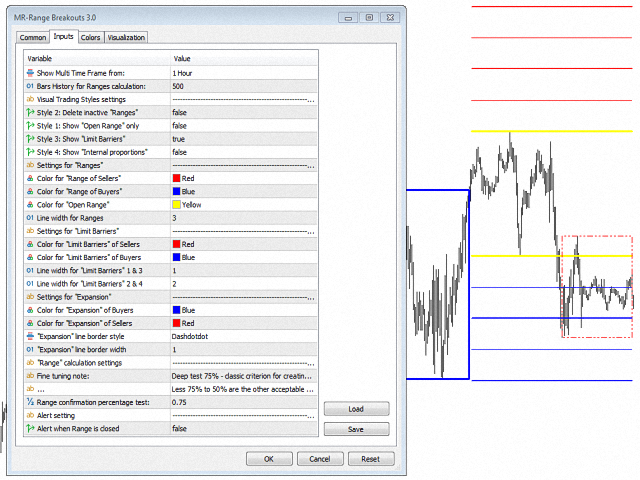

          Indicator settings:

          Show Multi Time Frame from: - Multi time frame on which to calculate the indicator. By default, the indicator works with data from time frame H4.
          Bars History for Ranges calculation: - Number of bars on which the indicator works from multi time frame H4.

          Section "Visual Trading Styles Settings"
          Style 1: Delete inactive "Ranges" - Shows or deletes "Ranges" closed by the price and shown with a dashed line.
          Style 2: Show "Open Range" only - Show only "Open Range" when this option is selected.
          Style 3: Show "Limit Barriers" - Shows or not "Limit Orders Barriers".
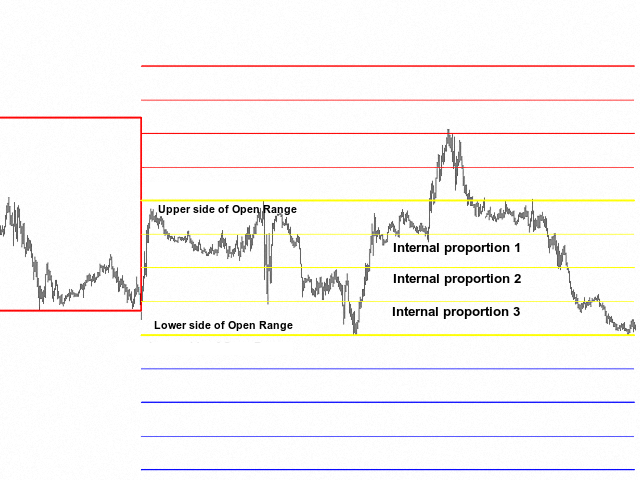
          Style 4: Show "Internal proportions" - Shows or not "Internal proportions" in the "Open Range".

          Section "Settings for Ranges"
          Color for "Range of Sellers" - You can select a color for "Range of Sellers".
          Color for "Range of Buyers" - You can select a color for "Range of Buyers".
          Color for "Open Range" - You can select a color for "Open Range".
          Line width for Ranges - You can select the line width for all non-closed Ranges.

          Section "Settings for Limit Barriers"
          Color for "Limit Barriers" of Sellers - You can select a color for "Limit Orders Barriers" of sellers.
          Color for "Limit Barriers" of Buyers - You can select a color for "Limit Orders Barriers" of buyers.
          Line width for "Limit Barriers" 1 & 3 - You can select the line width for "Limit Orders Barriers" 1 and 3. According to our research, these lines are less important to contain the price movement.
          Line width for "Limit Barriers" 2 & 4 - You can select the line width for "Limit Orders Barriers" 2 and 4. According to our research, these lines are more important to contain the price movement.

          Section "Settings for Expansion"
          Color for "Expansion" of Buyers - You can select a color for "Expansion" of buyers.
          Color for "Expansion" of Sellers - You can select a color for "Expansion" of sellers.
          "Expansion" line border style - You can select the line style for "Expansion".
          "Expansion" line border width - You can select the line width for "Expansion".

          Section "Range calculation settings"
          Range confirmation percentage test: - You can choose another setting to fulfill the "Range" formation criterion. By default, we set the test distance between two extremums equal to 75%. Other acceptable values are to 50%.

          Section "Alert setting"
          Alert when Range is closed - Displays an аlert when a "Range" is closed by the price movement and it is shown with a dashed line.

            レビュー 1
            David T
            226
            David T 2023.09.17 19:36 
             

            After downloading the demo I could see that this was something unseen and not mass distributed. I proceeded to the 1 year rental as I found it more economical versus the full price should the unlocked version not perform as in the tester. I am presently pleased even though the markets are closed during my backtesting this weekend , would be interesting to see if this repaints or lags. I am beginning to see that this is one of the most useful and powerful indicators ever produced provided it is used properly. My compliments to the author who has also responded in a timely fashion despite the time zone difference between our countries.

            おすすめのプロダクト
            Binary Options Support Resistance Indicator This indicator is designed for binary options trading and effectively shows retracements from support and resistance levels. Signals appear on the current candle. A red arrow pointing downwards indicates a potential selling opportunity, while a blue arrow pointing upwards suggests buying opportunities. All that needs adjustment is the color of the signal arrows. It is recommended to use it on the M1-M5 timeframes as signals are frequent on these timef
            VR Cub
            Vladimir Pastushak
            VR Cub は、質の高いエントリーポイントを獲得するためのインジケーターです。このインジケーターは、数学的計算を容易にし、ポジションへのエントリーポイントの検索を簡素化するために開発されました。このインジケーターが作成されたトレーディング戦略は、長年にわたってその有効性が証明されてきました。取引戦略のシンプルさはその大きな利点であり、初心者のトレーダーでもうまく取引することができます。 VR Cub はポジション開始ポイントとテイクプロフィットとストップロスのターゲットレベルを計算し、効率と使いやすさを大幅に向上させます。取引の簡単なルールを理解するには、以下の戦略を使用した取引のスクリーンショットを見てください。 設定、設定ファイル、デモ版、説明書、問題解決方法は、以下から入手できます。 [ブログ] レビューを読んだり書いたりすることができます。 [リンク] のバージョン [MetaTrader 5] エントリーポイントの計算ルール ポジションをオープンする エントリーポイントを計算するには、VR Cub ツールを最後の高値から最後の安値までストレッチする必要があります。
            Gvs Undefeated Trend   indicator is designed for trend and signal trading. This indicator generates trend signals.  It uses many algorithms and indicators to generate this signal. It tries to generate a signal from the points with the highest trend potential. This indicator is a complete trading product. This indicator does not need any additional indicators.  You can only trade with this indicator. The generated signals are displayed on the graphical screen.  Thanks to the alert features you ca
            これは、キャンドルの終値を予測する指標です。 このインジケータは、主にD1チャートでの使用を目的としていますが. この指標は、従来の外国為替取引とバイナリオプション取引の両方に適しています。 インジケーターは、スタンドアロンのトレーディングシステムとして使用することも、既存のトレーディングシステムへの追加として機能させることもできます。 このインジケーターは、現在のキャンドルを分析し、キャンドル自体の内部の特定の強度係数と、前のキャンドルのパラメーターを計算します。 したがって、この指標は、市場の動きのさらなる方向性と現在のキャンドルの終値を予測します。 この方法のおかげで、この指標は、短期の日中取引だけでなく、中期および長期の取引にも適しています。 インジケーターを使用すると、市場の状況の分析中にインジケーターが生成する潜在的な信号の数を設定できます。 インジケーターの設定には、このための特別なパラメーターがあります。 また、インジケーターは、チャート上のメッセージの形式で、電子メールで、およびPUSH通知の形式で、新しい信号について通知することができます。 購入後は必ず私に書いて
            This is a trend indicator without redrawing Developed instead of the binary options strategy (by the color of the Martingale candlestick) Also works well in forex trading When to open trades (binary options) A signal will appear in the place with a candle signaling the current candle It is recommended to open a deal for one candle of the current timeframe M1 and M5 When a blue dot appears, open a deal up When a red dot appears, open a trade down. How to open trades on Forex. When a signal is rec
            Trend Bilio - an arrow indicator without redrawing shows potential market entry points in the form of arrows of the corresponding color: upward red arrows suggest opening a buy, green down arrows - selling. The entrance is supposed to be at the next bar after the pointer. The arrow indicator Trend Bilio visually "unloads" the price chart and saves time for analysis: no signal - no deal, if an opposite signal appears, then the current deal should be closed. It is Trend Bilio that is considered
            Owl smart levels
            Sergey Ermolov
            4.63 (54)
            MT5版  |   FAQ Owl Smart Levels Indicator   は、 Bill Williams   の高度なフラクタル、市場の正しい波構造を構築する Valable ZigZag、エントリの正確なレベルをマークする Fibonacci レベルなどの一般的な市場分析ツールを含む 1 つのインジケーター内の完全な取引システムです。 利益を得るために市場と場所に。 戦略の詳細な説明 インジケータを操作するための指示 顧問-取引助手 プライベートユーザーチャット ->購入後に私に書いて、私はプライベートチャットにあなたを追加し、あなたはそこにすべてのボーナスをダウンロードすることができます 力はシンプルさにあります! Owl Smart Levels   取引システムは非常に使いやすいので、専門家にも、市場を勉強し始めて自分で取引戦略を選択し始めたばかりの人にも適しています。 戦略と指標に秘密の数式や計算方法が隠されているわけではなく、すべての戦略指標は公開されています。 Owl Smart Levels を使用すると、取引を開始するためのシグナルをすばやく確認し、
            The Infinity Expert Advisor is a scalper. When the resistance and support levels are broken, trades are opened in the direction of the price movement. Open positions are managed by several algorithms based on the current market situation (fixed stop loss and take profit, trailing stop, holding positions in case of trend indication, etc.). Requirements for the broker The EA is sensitive to spread, slippages and execution quality. It is strongly recommended not to use the EA for currencies with
            Noize Absorption Index - is the manual trading system that measures the difference of pressure between bears forces and bulls forces. Green line - is a noize free index that showing curent situation. Zero value of index shows totally choppy/flat market.Values above zero level shows how powerfull bullish wave is and values below zero measures bearish forces.Up arrow appears on bearish market when it's ready to reverse, dn arrow appears on weak bullish market, as a result of reverse expectation. S
            Indicator for binary options arrow is easy to use and does not require configuration works on all currency pairs, cryptocurrencies buy signal blue up arrow sell signal red down arrow tips do not trade during news and 15-30 minutes before their release, as the market is too volatile and there is a lot of noise it is worth entering trades one or two candles from the current period (recommended for 1 candle) timeframe up to m 15 recommended money management fixed lot or fixed percentage of the depo
            Shark Deal Book
            Philip Pankaj Suthagar
            4 (3)
            Term  "shark"  in the business world denotes a high volume investor who just made a good investment in a highly Potential business deal.So, sharks are the ones who make the market move. In our case, if an American shark bought a Japanese company, he/she has to convert American dollars into Japanese yen to make the deal. So, the demand for the Japanese yen will increase sharply. Thus USD/JPY will go short rapidly if the deal was from the shark. Another example, In the case of forex, if fed increa
            Wolfe waves ultra draws Wolfe Waves automatically. The indicator searches for the Wolfe Waves on three timeframes. This indicator is especially accurate because it waits for a breakout in the wave direction before signaling the trade, resulting in a very high winning ratio. Features Amazingly easy to trade. The indicator is able to recognize all Wolfe Wave patterns in a specified interval. Thus, we check each extremum for the potential 1,2,3,4,5 points apart from ZigZag vertices. The indicator
            KT Renko Patterns MT4
            KEENBASE SOFTWARE SOLUTIONS
            2.33 (3)
            KT Renko Patterns scans the Renko chart brick by brick to find some famous chart patterns that are frequently used by traders across the various financial markets. Compared to the time-based charts, patterns based trading is easier and more evident on Renko charts due to their uncluttered appearance. KT Renko Patterns features multiple Renko patterns, and many of these patterns are extensively explained in the book titled Profitable Trading with Renko Charts by Prashant Shah. A 100% automate
            Chart Patterns Detect 15 patterns (Ascending Triangle, Descending Triangle, Rising Wedge, Falling Wedge, Bullish Flag, Bearish Flag, Bullish Rectangle, Bearish Rectangle Symmetrical triangle, Head and Shoulders, Inverted Head and Shoulders, Triple top, Triple Bottom, Double Top, Double Bottom) Use historical data to calculate the probability of each pattern to succeed (possibility to filter notification according to the chance of success) gives graphic indication about the invalidation level and
            This is a new strategy for SUPPLY DEMAND areas It is based on a calculation using the tick volume to detect the big price action in market for both bear /bull actions this smart volume action candles are used to determine the supply and demand areas prices in between main supply and demand lines indicate sideway market  up arrows will be shown when prices moves above the main supply and the secondary supply lines Down arrows will be shown when prices moves below the main demand and the secondary
            ナイト ゴースト - バイナリ オプションの矢印インジケーター。 これからのあなたの頼もしいアシスタントです! 11 - チャートの再描画なし - すべての通貨ペアで大活躍! -インジケータの精度は最大 90% (特に夜間) ・長時間の設定不要(バイナリーオプションに最適な設定) - 信号が遅れない - 現在のローソク足でのシグナルの出現 ・M1期にピッタリ(No More!) ・目に優しいキャンドルカラー(赤・青) -インストールされたアラート それを扱う: - 青い矢印は信号アップを示します -赤い下向き矢印 M1 以上のインジケーターをチャートに配置しないでください. シグナルの精度が低下します! インジケーターのスクリーンショットとビデオを見る
            Magic EA MT4
            Kyra Nickaline Watson-gordon
            3 (1)
            Magic EA is an Expert Advisor based on Scalping, Elliot Waves and with filters such as RSI, Stochastic and 3 other strategies managed and decided with the robot smartly. Large number of inputs and settings are tested and optimized and embedded in the program thus inputs are limited and very simple. Using EA doesn't need any professional information or Forex Trading Knowledge. EA can trade on all symbols and all time frames, using special and unique strategies developed by the author. The EA
            This unique multi-currency strategy simultaneously determines the strength of trends and market entry points, visualizing this using histograms on the chart. The indicator is optimally adapted for trading on the timeframes М5, М15, М30, Н1. For the convenience of users, the indicator renders the entry point (in the form of an arrow), recommended take profit levels (TP1, TP2 with text labels) and the recommended Stop Loss level. The take profit levels (TP1, TP2) are automatically calculated for
            The new update makes this indicator a complete tool for studying, analyzing and operating probabilistic patterns. It includes: On-chart Multi-asset percentage monitor. Configurable martingales. Twenty-one pre-configured patterns , including Mhi patterns and C3. An advanced pattern editor to store up to 5 custom patterns. Backtest mode to test results with loss reports. Trend filter. Hit operational filter. Martingale Cycles option. Various types of strategies and alerts. Confluence between patte
            [ZhiBiCCI]インディケータは全てのサイクル使用に適しており、そして全ての市場品種にも適しています。 [ZhiBiCCI]緑色の実線は強気の発散の逆転です。緑色の点線は古典的な強気の発散です。 [ZhiBiCCI]赤への実線は逆弱気の発散である。赤い点線は古典的な弱気の発散です。 [ZhiBiCCI]はパラメータ(アラート、メール送信、通知送信)で設定でき、(true)に設定するとインスタント信号をアラームウィンドウに送信し、Eメール、インスタントメッセージを送信できます。 パラメータ設定の説明 [displayAlert]:これはアラームスイッチで、trueに設定され、矢印が表示されればプロンプトに自動的に警告され、falseに設定されれば警告されません。 [sendmail_NO_OFF]:これはメールを送信するためのスイッチで、trueに設定します。矢印が表示されていればMT4で設定したメールボックスにメールを送信し、falseに設定されていればメールを送信しません。 [sendnotification_NO_OFF]:これはインスタントメッセー
            This indicator displays Stochastic osc signals on the price chart and allows the user to receive notifications of such signals. The Stochastic indicator is a classic and proven indicator of the technical analysis of the markets. Despite its age, it is still relevant today. Depending on the settings, the indicator allows you to work effectively on various TFs and any markets. Signals are given on fully formed bars and are not redrawn. Custom Parameters: Stochastic_Price (0-1) - The applied pric
            FREE
            MACD Color for GOLD  Use for looking moving-way of graph and checking will be buy or sell  Easy for looking by see the color of trand. Red is down / Blue is up.  Can to use it with every time-frame by 1. Long Trade : Use it with time-frame H1 /  H4 /  Daily  2.Short Trade : Use it with  time-frame  M5 / M15  / M 30 /  H1 and you can see when you will open or close the orders by see this indicator by well by see signal line cut with color line again in opposite. and you can use this indicator for
            SuperTrend Alerts adds alerts to the widely popular SuperTrend indicator. As the name suggests, SuperTrend is a trending indicator which works best in trendy (not choppy) markets. SuperTrend is extremely popular for intraday and daily trading, and can be used on any timeframe. Place a call when the price closes above the SuperTrend line, and place a put when the price closes below the SuperTrend line. These crossovers are highlighted by non-repainting up/down arrows. Alerts Email, message and
            まず第一に、この取引インジケーターは再描画されず、再描画されず、遅延しないことを強調する価値があります。これにより、手動取引とロボット取引の両方に理想的なものになります。 アトミックアナリストは、価格の強さとモメンタムを利用して市場でより良いエッジを見つけるためのPA価格アクションインジケーターです。ノイズや誤ったシグナルを除去し、取引ポテンシャルを高めるための高度なフィルターを備えています。複雑なインジケーターの複数のレイヤーを使用して、アトミックアナリストはチャートをスキャンし、複雑な数学的計算をシンプルなシグナルと色に変換します。これにより、どのような初心者トレーダーでも理解して使用し、一貫した取引の決定を行うことができます。 「アトミックアナリスト」は、新規および経験豊富なトレーダー向けにカスタマイズされた包括的な取引ソリューションです。プレミアムインジケーターとトップノッチの機能を1つの取引戦略に組み合わせ、すべてのタイプのトレーダーにとって汎用性のある選択肢にします。 デイリートレーディングとスキャルピング戦略:高速で正確なデイトレーディングおよび短期トレード
            Indicator. "Indicator wave or Indicator Ma". Using 23 standard indicators and the author's algorithm, the levels of purchases (from 0 to +100) and sales (from 0 to -100) are calculated. Then, using the calculated levels, the "Wave Indicator" draws a wave with 21 moving averages. The wave number is equal to the averaging period of the calculated levels. Waves # 1 - 7 Fast Moving Averages Waves from No. 8 -14 moving averages Waves from No. 15-21 slow moving averages Looking at the figu
            GOAL TIME is an expert advisor based on the notion of time, it studies the change of price according to time, and it finally detects the best time to execute a good order. The EA is based on an indicator that draws a price curve in relation to time, this curve is deduced by an algorithm that analyzes old data. Then, the EA exploits the generated curve and executes the correct order. In case of incorrect choice, the EA has the mission to limit the losses. After a thorough study of this strategy o
            Super Gator
            Agustinus Biotamalo Lumbantoruan
            This indi shows the following 1. Supertrend 2. Alligator (Not a regular alligator) 3. ZigZag 4. Moving Average 5. Trend Continuation/Mini correction Signal (plotted in X) (See screenshots in green background color 6. Early Signal Detection (See screenshots in green background color) You may treat Alligator as the lagging indicator The leading indicator is the supertrend. The zig zag is based on the leading indicator where it gets plotted when the leading indicator got broken to the opposite.
            Introducing the "Magic Trades" for MetaTrader 4 – your ultimate tool for precision trading in dynamic markets. This innovative indicator revolutionizes the way you perceive market trends by harnessing the power of advanced analysis to detect subtle changes in character, paving the way for optimal trading opportunities. The Magic Trades Indicator is designed to empower traders with insightful entry points and well-defined risk management levels. Through its sophisticated algorithm, this indica
            Perfect Trade System   indicator is designed for trend and signal trading. This indicator generates trend signals.  It uses many algorithms and indicators to generate this signal. It tries to generate a signal from the points with the highest trend potential. This indicator is a complete trading product. This indicator does not need any additional indicators.  You can only trade with this indicator. The generated signals are displayed on the graphical screen.  Thanks to the alert features you ca
            このプロダクトを購入した人は以下も購入しています
            A key element in trading is zones or levels from which decisions to buy or sell a trading instrument are made. Despite attempts by major players to conceal their presence in the market, they inevitably leave traces. Our task was to learn how to identify these traces and interpret them correctly. Reversal First Impulse levels (RFI)   -  Version MT5                INSTRUCTIONS                 RUS                 ENG                                       R ecommended to use with an indicator   -  
            TrendMaestro
            Stefano Frisetti
            5 (2)
            note: this indicator is for METATRADER4, if you want the version for METATRADER5 this is the link: TRENDMAESTRO recognizes a new TREND in the bud, he never makes mistakes. The certainty of identifying a new TREND is priceless. DESCRIPTION TRENDMAESTRO identifies a new TREND in the bud, this indicator examines the volatility, volumes and momentum to identify the moment in which there is an explosion of one or more of these data and therefore the moment in which prices have strong probability of f
            現在20%OFF! 初心者やエキスパートトレーダーのためのベストソリューション! このダッシュボードソフトウェアは、28の通貨ペアで動作しています。それは私達の主要な指標(高度な通貨の強さ28と高度な通貨インパルス)の2に基づいています。それは全体の外国為替市場の大きい概観を与えます。それは、すべての(9)時間枠で28の外国為替ペアのための高度な通貨の強さの値、通貨の動きの速度と信号を示しています。チャート上で1つのインディケータを使用して市場全体を観察し、トレンドやスキャルピングの機会をピンポイントで見つけることができたら、あなたのトレードがどのように改善されるか想像してみてください。 このインディケータには、強い通貨と弱い通貨の識別、潜在的な取引の識別と確認がより簡単になるような機能が搭載されています。このインディケータは、通貨の強さや弱さが増加しているか減少しているか、また、すべての時間枠でどのように機能しているかをグラフィカルに表示します。 新機能として、現在の市場環境の変化に適応するダイナミックなマーケットフィボナッチレベルが追加され、すでに当社のAdvan
            驚異的なFXインジケーター「Miraculous」をご紹介します。完璧な結果を得るための1時間足を含むすべてのタイムフレームで効果的に機能する、最強の強力な特殊MT4フォレックスインジケーターです。 すべてのタイムフレームで優れた結果を提供する最高のFXインジケーターを探し続けるのに疲れましたか?これ以上探す必要はありません!「Miraculous」フォレックスインジケーターをご紹介します。このインジケーターは、トレーディングの経験を変革し、収益を新たなレベルに引き上げるために設計されました。 先進のテクノロジーと長年にわたる緻密な開発に基づいて構築された「Miraculous」フォレックスインジケーターは、FX市場における力と正確さの頂点となります。この素晴らしいツールは、すべてのレベルのトレーダーのニーズを満たすように設計されており、一貫した収益性を追求する上で比類のない優位性を提供します。 「Miraculous」フォレックスインジケーターの他との違いは、その非常に適応性にあります。デイトレーダー、スウィングトレーダーであろうと、長期ポジションを好む方であろうと、このインジケータ
            このインジケータは、手動および自動的な方法でチャートに描かれたハーモニックパターンを検出します。ユーザーマニュアルは、このリンクから参照できます: あなたのレビューを追加し、入手するために私たちに連絡してください。 この製品をmt4で試すための無料版があります。 GartleyおよびNenstarパターンを検出するために使用できます。 https://www.mql5.com/en/market/product/30181 完全なMT4バージョンを購入するには、次の場所から購入できます。 https://www.mql5.com/en/market/product/15212 注 インジケータにはコントロールパネルがあり、すべての(チャート&時間枠)設定が保存されます。チャート上でスペースをより多く確保するために、最小化することができ、他の分析ツールで作業する場合は、すべてのインジケータデータを非表示にするために閉じるボタンを押すことができます。 このインジケータを使用して設定を変更し、移動平均やボリンジャーバンドなどのインジケータを追加すると、編集のテンプレートが自動的に保存され、必
            FX Volume
            Daniel Stein
            4.6 (35)
            mql5と Telegramの モーニング・ブリーフィングで、詳細とスクリーンショットを含む毎日のマーケット・アップデートをご覧 ください! FX Volumeは、ブローカーの視点から市場のセンチメントをリアルに洞察する、最初で唯一の出来高インジケーターです。 ブローカーのような機関投資家が外国為替市場でどのようなポジションをとっているか、COTレポートよりもはるかに速く、素晴らしい洞察を提供します。 この情報をチャート上で直接見ることは、あなたの取引にとって真のゲームチェンジャーであり、画期的なソリューションです。 以下のようなユニークなマーケットデータ洞察から利益を得てください。 比率は 、通貨のロングポジションとショートポジションの比率をパーセントで表示します。 比率の変化は 、選択した期間内のロング比率とその変化率を表示します。 Volumes Totalは 、通貨の取引量(ロングとショート)の合計をロット単位で表示します。 Volumes Long :全通貨のロングポジションの取引量を表示します。 Volumes(ショート )は、全通貨のショートポジションの取引量を表示
            How to use Pair Trading Station Pair Trading Station is recommended for H1 time frame and you can use it for any currency pairs. To generate buy and sell signal, follow few steps below to apply Pair Trading Station to your MetaTrader terminal. When you load Pair Trading Station on your chart, Pair Trading station will assess available historical data in your MetaTrader platforms for each currency pair. On your chart, the amount of historical data available will be displayed for each currency pai
            Cycle Sniper
            Elmira Memish
            4.41 (34)
            NEW YEAR SALE PRICE FOR LIMITED TIME!!! Please contact us after your purchase and we will send you the complimentary indicators to complete the system Cycle Sniper is not a holy grail but when you use it in a system which is explained in the videos, you will feel the difference. If you are not willing to focus on the charts designed with Cycle Sniper and other free tools we provide, we recommend not buying this indicator. We recommend watching the videos about the indiactor and system before pu
            TakePropips Donchian Trend Pro
            Eric John Pajarillaga Aldana
            4.82 (17)
            TakePropips Donchian Trend Pro   (MT4) は、ドンチャン チャネルを使用してトレンドの方向を自動的に検出し、エントリーとエグジットの取引シグナルを提供する強力で効果的なツールです! この多機能インジケーターには、トレンド スキャナー、取引シグナル、統計パネル、スクリーナー、取引セッション、およびアラート履歴ダッシュボードが含まれます。取引シグナルを提供し、チャートを分析する時間を節約するように設計されています! ユーザー マニュアルとインストール ガイドは、ブログ投稿 (   https://www.mql5.com/en/blogs/post/751368   ) からダウンロードできます。 今日は 50% オフ! 98ドルから49ドルに値下げ! このインジケーターは、ストラテジー テスターでテストできます (ビジュアル モードを有効にします)。ライブ チャートでテストしたい場合は、7 日間の試用版を入手するようにメッセージを送ることもできます。 詳細については、説明の下にあるビデオ チュートリアルも利用できます。 ご不明な点やサポートが必
            Step into the realm of Forex trading with confidence and precision using XQ, a cutting-edge Forex indicator designed to elevate your trading game to unprecedented heights. Whether you're a seasoned trader or just stepping into the world of currency exchange,   XQ Forex Indicator   empowers you with the insights and signals needed to make informed trading decisions. The signal conditions are a combination of three indicators, and XQ Forex Indicator only display  medium and long-term trends . The
            ON Trade Waves Patterns Harmonic Elliot Wolfeをご紹介します。これは手動および自動の方法を使用して市場のさまざまなパターンを検出するために設計された高度なインジケーターです。以下はその動作方法です: ハーモニックパターン: このインジケーターは、チャートに表示されるハーモニックパターンを識別できます。これらのパターンは、Scott Carneyの「Harmonic Trading vol 1および2」で説明されているように、ハーモニックトレーディング理論を実践するトレーダーにとって重要です。手動で描画するか、自動検出に頼るかにかかわらず、ON Trade Waves Patternsがお手伝いします。 コントロールパネル: このインジケーターはユーザーフレンドリーなコントロールパネルを備えています。チャートと時間枠の設定を保存し、異なる構成間をスムーズに切り替えることができます。チャートスペースを最大限に活用するために最小化することもできます。他の分析ツールで作業することを好む場合、閉じるボタンをクリックするだけで、すべてのインジケーターデ
            もちろんです。以下は、提供いただいたテキストの日本語への翻訳です: MT4用の天文学指標をご紹介します:究極の天体トレーディングコンパニオン トレーディング体験を天空の高みに高める準備はできていますか?私たちの革命的なMT4用の天文学指標をご紹介します。この革新的なツールは、複雑なアルゴリズムの力を借りて、類まれなる天文学的洞察と精密な計算を提供します。 あなたの指先で宇宙の情報を: 宝のような天文学的データが明らかになる包括的なパネルをご覧ください。惑星の地理的/太陽中心座標、太陽と地球の距離、星の大きさ、伸び、星座、黄道座標および赤道座標、さらには水平座標まで、それぞれが綿密に計算され美しく表示されています。指標によって生成される垂直線は時間値に対応し、トレーディングの旅に宇宙の視点を提供します。 惑星のラインと関係: グラフを飾る惑星のラインの魔法を体験し、スケールと角度をカスタマイズできます。直感的なコントロールパネルを介して各惑星のラインの表示を簡単に切り替えることができます。指定された時刻範囲内での合会、六分会、四分会、三分会、対会、逆行の指標で天体の関係の芸術を発見してく
            現在20%OFF! このダッシュボードは、複数のシンボルと最大9つのタイムフレームで動作するソフトウェアの非常に強力な部分です。 このソフトは、弊社のメインインジケーター(ベストレビュー:Advanced Supply Demand)をベースにしています。    Advanced Supply Demand ダッシュボードは、素晴らしい概要を提供します。それは示しています。  ゾーン強度評価を含むフィルタリングされた需給値。 ゾーン内/ゾーンへのPips距離。 ネストされたゾーンがハイライトされます。 選択されたシンボルの4種類のアラートを全ての(9)時間枠で提供します。 それはあなたの個人的なニーズに合わせて高度に設定可能です。 あなたの利益! すべてのトレーダーにとって最も重要な質問です。 市場に参入するのに最適なレベルはどこか? 成功のチャンスとリスク/リターンを得るために、強力な供給/需要ゾーン内またはその近くで取引を開始します。 損切りの最適な位置はどこですか? 最も安全なのは、強力な供給/需要ゾーンの下/上にストップを置くことで
            Ultimate Sniper Dashboard
            Hispraise Chinedum Abraham
            4.84 (25)
            299ドルで割引中! 今後値上げの可能性あり! 下の説明を読んでください! 究極のスナイパーダッシュボードのための最高のエントリーシステム。究極のダイナミックレベル。(私の製品をチェックしてください) 究極のスナイパーダッシュボードはMT4多通貨テスト制限のため、ライブマーケットでのみ作動します。 究極のスナイパーダッシュボードをご紹介します。HA-Sniper、MA-Sniper、その他多くの特別なモードが含まれる最高の製品です。究極のスナイパーダッシュボードは絶対的な獣です! 初心者やエキスパートトレーダーにとって最高のソリューションです。もう二度と動きを見逃さない! シンプルさとピップを愛するトレーダーのために、特別な製品をご用意しました。シンプルでありながら、ダッシュボードは複数のカスタムアルゴリズムに基づき28の通貨ペアを監視し、すべての作業を行います。たった一つのチャートで、プロのように市場を読み解くことができます。もし、為替ペアが動き出したときに、その方向性を正確に特定することができれば、あなたの取引はどれほど改善されることでしょう。   当社のシ
            TPA True Price Action indicator reveals the true price action of the market makers through 100% non-repainting signals (except early signals mode) strictly at the close of a candle! TPA shows entries and re-entries, every time the bulls are definitely stronger than the bears and vice versa. Not to confuse with red/green candles. The shift of power gets confirmed at the earliest stage and is ONE exit strategy of several. There are available now two free parts of the TPA User Guide for our custo
            PZ Day Trading
            PZ TRADING SLU
            3.67 (3)
            このインディケータは、価格アクション分析とドンチャンチャネルのみを使用して、ジグザグ方式で価格の反転を検出します。再描画やバックペインティングを一切行わずに、短期取引向けに特別に設計されています。それは彼らの操作のタイミングを増やすことを目指している賢明なトレーダーにとって素晴らしいツールです。 [ インストールガイド | 更新ガイド | トラブルシューティング | よくある質問 | すべての製品 ] 驚くほど簡単に取引できます すべての時間枠で価値を提供します 自己分析統計を実装します 電子メール/音声/視覚アラートを実装します 可変長のブレイクアウトと混雑ゾーンに基づいて、インディケータは価格アクションのみを使用して取引を選択し、市場が非常に高速に行っていることに反応します。 過去のシグナルの潜在的な利益が表示されます この指標は、独自の品質とパフォーマンスを分析します 負けブレイクアウトは強調表示され、説明されます インジケータは、非バックペインティングおよび非再ペイントです この指標は、日中のトレーダーが単一の価格反転を見逃さないようにするのに役立ちます。ただし、す
            Please send me Direct message on MQL5 CHAT after purchasing the Indicator for Training and Installation Support There are some additional files that is important to use with the Indicator . So be sure to contact me after purchasing the Indicator So that I can add you for training and support . If you find any difficulty with installation then send me Direct message here So that I can connect with you via Anydesk or Teamview for the product installation. " Smart Order Block Indicator " to find
            Indicator : RealValueIndicator Description : RealValueIndicator is a powerful tool designed specifically for trading on the EURUSD pair. This indicator analyzes all EUR and USD pairs, calculates their real currency strength values, and displays them as a single realistic value to give you a head start on price. This indicator will tell you moves before they happen if you use it right. RealValueIndicator allows you to get a quick and accurate overview of the EURUSD currency pair tops and bottoms,
            Gann Signal is a very simple indicator at first glance, but hidden inside is many years of experience in studying W.D.Ganna methods. The indicator gives accurate BUY/SELL signals, without redrawing. The indicator is very easy to use. All you need to do is attach it to your chart and follow its recommendations. The indicator constantly analyzes the market for entry opportunities. When such an opportunity appears, the indicator gives a signal in the form of an arrow. I repeat, all signals are NOT
            [ MT5 Version ] Order Block Indicator MT4 Order Block Indicator MT4  is currently the most accurate and customizable indicator in the market. It has been developed to facilitate the analysis of operations based on Order Blocks and Supply and Demand Zones. These zones are possible reversal points of a movement. Order Blocks indicate a possible accumulation of orders in one area. The price usually gets to reach and react strongly to those areas. The most relevant levels for this reaction are the c
            Volatility Trend System - a trading system that gives signals for entries. The volatility system gives linear and point signals in the direction of the trend, as well as signals to exit it, without redrawing and delays. The trend indicator monitors the direction of the medium-term trend, shows the direction and its change. The signal indicator is based on changes in volatility and shows market entries. The indicator is equipped with several types of alerts. Can be applied to various trading
            SMCpro VIP MT4  Original Price  $620   ---  Currently Price 20% OFF ( for unlimited use )   BONUS  AUX VIP Club 2024 : Include  EA Airbag  and  Load Data History  to enhance the performance of this tool to its maximum potential  Click Here to Download Files   ( for users only )   Hello World! Introducing.. SMCpro VIP tool and Indicator for MetaTrader 4, designed to revolutionize your trading experience with the ICT Smart Money Concept. This system is meticulously crafted to empower trad
            Candle Power Pro
            Thushara Dissanayake
            4.33 (6)
            Candle Power Pro インジケーターを使用して、実際のボリューム情報の力を解き放ちます。この動的ツールは、各ローソク足の実際の体積データを取得し、それを総体積のパーセンテージとして表示します。そうすることで、市場での買い手と売り手の間で進行中の争いを識別できるようになります。 Candle Power Pro は、買い手と売り手の争いを総取引高に対する割合として表示し、市場のダイナミクスに関する貴重な洞察を提供します。買い手と売り手のボリュームを分析することでブレイクアウトを簡単に確認でき、より正確なエントリーポイントとエグジットポイントを確保できます。さらに、買い手と売り手のボリュームを利用して傾向を確認することができ、取引戦略の信頼性が高まります。さらに、買い手と売り手の量の変化を分析することでトレンドの反転を特定できるため、市場の変化に先んじることができます。 このインジケーターは、取引体験を向上させるためのさまざまな機能を提供します。簡単に視覚化できるようにボリューム平均を線として描画したり、ボリュームのパーセンテージを他の 19 個のシンボルと比較してさらに分析し
            Features for software Main functions: Accurate entry signals WITHOUT REPAINTING! Once a signal appears, it remains valid! This is a significant distinction from repainting indicators that might provide a signal and then alter it, potentially leading to deposit losses. Now, you can enter the market with higher probability and precision. There's also a function to colour candles after an arrow appears until the target (take profit) is reached or a reversal signal appears . Display of STOP LOSS
            Weis Wave with Alert
            Trade The Volume Waves Single Member P.C.
            4.79 (19)
            Rental/Lifetime Package Options and Privileges' * For optimum results the yearly or lifetime package is suggested due to live training and Discord  channel trading with the  creator! Rent Monthly Six Months   Yearly/Lifetime Weis Wave with Speed with Alert+Speed Index x x x Manual  x x x Quick Set up Video x x x Blog x x x Lifetime Updates x x x Setup and Training Material x x Free Rectangle Break Alert Tool      x Discord Access Channel "The SI traders" x 2-hour live methodology traini
            マーチンゲールアローは、マーチンゲールバイナリーオプション取引用に設計された矢印タイプのMT4インジケーターで、この矢印はバーオープン/バー内に印刷され、アラートを与えます。 使用方法: 矢印が表示された瞬間に取引を開始し、取引が勝った場合は次のシグナルを待って同じロットを取引します。次のシグナルでトレードがダブルロットを失い、シグナルが勝つまでそれを続けた場合、リセットして最初のトレードロットでトレードします。 推奨される期間 : 任意 最低入金額: 200 ユニット。 このインジケーターはライブでは再ペイント/バックペイントを行いません。 -------------------------------------------------- ------------- パラメーター : インジケーター期間: これを変更すると、異なるシグナルが表示されます。 インジケーターの価格/種類 買われすぎ/売られすぎレベル アラート入力 矢印スタイル ========================================
            System Trend Pro - This is the best trend trading indicator!!! The indicator no repaint!!!   The indicator has   MTF   mode, which adds confidence to trading on the trend (   no repaint   ). How to trade? Everything is very simple, we wait for the first signal (big arrow), then wait for the second signal (small arrow) and enter the market in the direction of the arrow. (See screens 1 and 2.) Exit on the opposite signal or take 20-30 pips, close half of it, and keep the rest until the oppo
            A. A2SR とは何ですか ?   * 先行テクニカル指標です (塗り直しなし、ラグなし)。 -- ガイダンス : -- https://www.mql5.com/en/blogs/post/734748/page4#comment_16532516 -- そして https://www.mql5.com/en/users/yohana/blog A2SR には、サポート (需要) とレジスタンス (供給) のレベルを決定する特別な手法があります。 ネットで見かける通常の方法とは異なり、A2SR は実際の SR レベルを決定する独自のコンセプトを持っています。 元の手法はインターネットから取得されたものではなく、インターネット上で公開されたこともありません。 A2SR は、取引スタイルに応じて SR レベルを自動選択します。 時間枠を変更しても、SR レベルはその位置にとどまります。 実際のSRは、使用する時間枠から取得されるわけではないため. A2SR には、取引のための完全な手段があります 。 実際のサポート (需要) とレジスタンス (供給) の真のコンセプト。
            クリスマスセール!40% OFF!1月1日に価格が$250に値上がり! GoldenGate Entriesをご紹介します:最先端のトレーディングソリューション! GoldenGate Entries(GGE)を使用して取引する革新的なアプローチを発見しましょう。GGEは、取引体験を向上させるために設計された先進的なインジケーターで、ユーザーに正確性と自信を持たせるための包括的な機能を提供します。 通貨ペア:Any(FX - 商品 - 株式 - 株式 - クリプト) タイムフレーム:15分からH1 主な特徴: 買いと売りの矢印の指示:常に情報を受け取るために、買いと売りの矢印の指示をポップアップアラートとともに受け取ります。 GoldenGate_Algo:GoldenGate_Algoを使用して市場の状況を把握し、市場が「売り過ぎ」または「買い過ぎ」かどうかを評価する強力なツールです。 現在のトレンド分析:視聴中のタイムフレームで現在のトレンドにアクセスして、取引を市場の主流方向に合わせることができます。 組み込みのピボットポイント:組み込まれた
            Full Forex Market View Dashboard
            Opengates Success International
            5 (2)
            FULL FOREX MARKET VIEWダッシュボードインジケーター これは、トレーダーが市場で何が起こっているかを完全に把握できるようにするために作成されたカスタム指標です。 リアルタイム データを使用して市場にアクセスし、取引を成功させるために必要なあらゆる情報を表示します。 インストール: このインジケーターをウィンドウ チャートに添付する前に、MT4 のマーケット ウォッチ パネルに移動し、不要な通貨ペアまたは取引しないすべての通貨ペアを非表示にして、残りをそこに残します。 その理由は、FFMV ダッシュボードが MT4 の気配値表示に表示されるすべての通貨ペアを表示するためです。 最大 30 通貨ペア以下を表示できます。 MT4 の気配値表示でそれ以上だと、FFMV ダッシュボードのフォントと画像がぼやけて変形します。 正しく表示されません。 使用法:      個人取引の場合      バスケット取引の場合 (方法についてはスクリーンショットを参照してください)      複数注文取引にも使用可能      独自の取引システムなどから
            作者のその他のプロダクト
            In the "Masters of Risk" trading system, one of the main concepts is related to places where markets change direction. In fact, this is a change in priority and a violation of the trend structure at the extremes of the market, where supposedly there are or would be stop-losses of "smart" participants who are outside the boundaries of the accumulation of volume. For this reason, we call them "Reversal Patterns" - places with a lot of weight for the start of a new and strong trend. Some of the imp
            The most crucial price level in any "Volume Profile" is the "Point of Control" . Is the price level with the highest traded volume. And mainly, is the level where the big guys start there their positions, so it's an accumulation/distribution level for smart money. The idea of the indicator arose after the "MR Volume Profile Rectangles" indicator was made. When creating the "MR Volume Profile Rectangles" indicator, we spent a lot of time comparing the volumes with those from the volume profil
            " A trading range occurs when a financial instrument trades between constant high and low prices over a period of time. The upper part of the trading range of a financial instrument often provides price resistance, while the lower part of the trading range usually offers price support.  Traders can enter in the direction of a breakout or breakdown from a trading range... " This is the "Classical Theory" understanding of ranges. We have a different understanding of the nature of ranges and th
            In the "Masters of Risk" trading system, one of the main concepts is related to places where markets change direction. In fact, this is a change in priority and a violation of the trend structure at the extremes of the market, where supposedly there are or would be stop-losses of "smart" participants who are outside the boundaries of the accumulation of volume. For this reason, we call them "Reversal Patterns" - places with a lot of weight for the start of a new and strong trend. Some of the im
            The most crucial price level in any "Volume Profile" is the "Point of Control" . Is the price level with the highest traded volume. And mainly, is the level where the big guys start there their positions, so it's an accumulation/distribution level for smart money. The idea of the indicator arose after the "MR Volume Profile Rectangles" indicator was made. When creating the "MR Volume Profile Rectangles" indicator, we spent a lot of time comparing the volumes with those from the volume profil
            A "Volume Profile" is an advanced charting indicator that displays total volume traded at every price level over a user specified time period. The main components of the volume profile are POC ( Point Of Control - the price level, at which the maximum number of contracts were executed during a selected period), VAH ( Value Area High - the highest price in the Value Area) and VAL ( Value Area Low - the lowest price in the Value Area). When we settled on the original indicator, we spent a lot o
            The most crucial price level in any "Volume Profile" is the "Point of Control" . Is the price level with the highest traded volume. And mainly, is the level where the big guys start there their positions, so it's an accumulation/distribution level for smart money. The idea of the indicator arose after the "MR Volume Profile Rectangles" indicator was made. When creating the "MR Volume Profile Rectangles" indicator, we spent a lot of time comparing the volumes with those from the volume profil
            We publish the indicator as a useful tool in trading and call this indicator the "Swiss Army Knife" because it provides many possibilities and combinations to help understand the material on the "Masters of Risk" trading system. The indicator itself is not part of the tools used in the "Masters of Risk" trading system. The indicator consists of 3 separate multi-timeframe indicators, which in combination with each other help to reduce the "noise" of false signals. The first of the indicators ar
            "Sentiments of traders" in the financial markets is a topic that has been of interest to us for a long time. In time, we could not find the right formula to define these sentiments. We went through many stages in the search for the right methodology - from taking data from external sources to calculate open positions of buyers and sellers to calculating tick volumes, but still we were not satisfied with the results. The calculation of open positions of buyers and sellers from external sources ha
            フィルタ:
            David T
            226
            David T 2023.09.17 19:36 
             

            After downloading the demo I could see that this was something unseen and not mass distributed. I proceeded to the 1 year rental as I found it more economical versus the full price should the unlocked version not perform as in the tester. I am presently pleased even though the markets are closed during my backtesting this weekend , would be interesting to see if this repaints or lags. I am beginning to see that this is one of the most useful and powerful indicators ever produced provided it is used properly. My compliments to the author who has also responded in a timely fashion despite the time zone difference between our countries.

            Sergey Khramchenkov
            2077
            開発者からの返信 Sergey Khramchenkov 2023.09.18 07:03
            Thank you David T!!!
            レビューに返信
            バージョン 3.1 2023.03.29
            - Corrected text in indicator settings.
            バージョン 3.0 2023.03.28
            - Part of the terminology has been changed.
            - "New Range" has been renamed to "Open Range".
            - The "Open Range" is visualized by upper and lower lines.
            - Added more "Limit Barriers".
            - Added "Expansion of Buyers" and "Expansion of Sellers".
            - Improved some technical details.
            バージョン 2.0 2021.11.01
            Major upgrade of the indicator.
            The formula for determining the ranges has been rewritten.

            Added:
            1. Automatic determination of the area of limit barriers.
            2. Show a potential new range or potential extension of the existing one.