Euro Fx Vix MT5
- インディケータ
- Manuel Alejandro Cercos Perez
- バージョン: 4.0
- アップデート済み: 14 7月 2022
- アクティベーション: 20
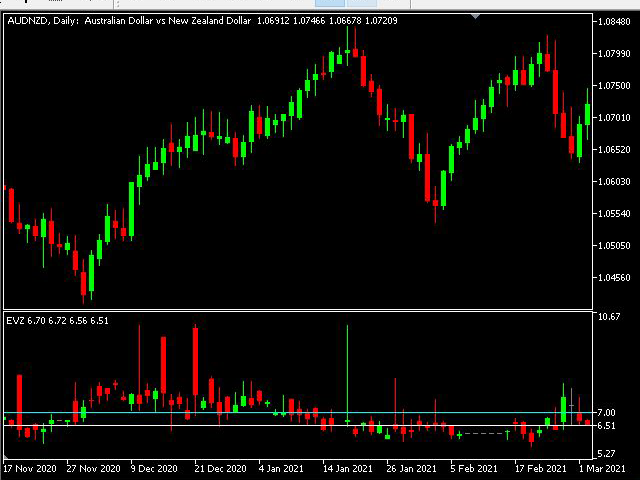
このボラティリティインディケータは、死んだ市場を検出するのに便利です。ユーロのボラティリティーを測定するEVZ指数に基づいています(ただし、外国為替市場全体に適用することもできます)。高い値は、市場での高いボリューム/ボラティリティを表します。7以下の場合は、ボリュームが少なく、取引時のリスクが大きいことを示しています。
No Nonsense Forex(NNFX)手法を使用しているトレーダーにとって、このインジケーターはアルゴリズムのバックテストやEVZが与える影響を測定するのに役立ちますし、取引の際にチャートで直接読み取ることもできます。
このインジケーターが正しく動作するために必要なデータを取得するには、EVZ Reader(無料)をダウンロードしてください。
特徴
- このインディケータは、プログラム「EVZリーダー」によって取得されたデータを読み取るもので、このインディケータが動作するために必要なものです。このリーダーが1つのチャートで有効であれば、EVZはほぼリアルタイムで更新されます。
- このインジケーターの複数のインスタンスを複数のチャートに配置しても、パフォーマンスに問題はありません。
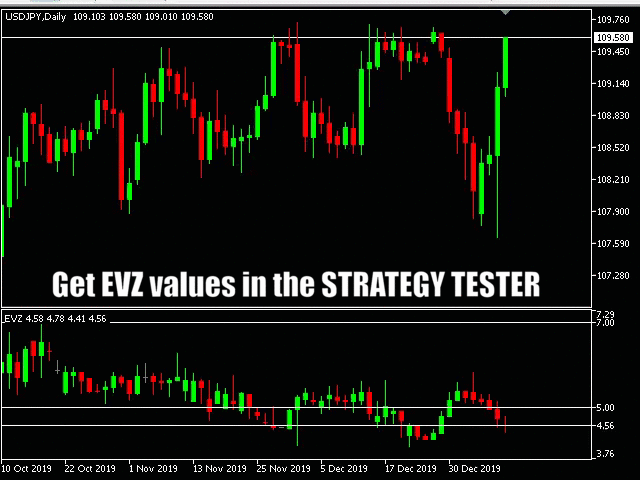
- ストラテジーテスターで動作し、その値は他のインジケーターと同様にアクセスできます。
- 2008年8月以降のEVZのデータはありません。
- フォレックス・マーケットがオープンしても、EVZがオープンしない日もあります。そのような場合は、EVZの最後の終値の値でフラットローソクを作成します。
また、MetaTrader4用のEuro FX VIXもダウンロードできます。