TrendMeasurer indicator manual
- インディケータ
- Anton Polkovnikov
- バージョン: 1.0
- アクティベーション: 5
TrendMeasurer indicator manual / TMi manual
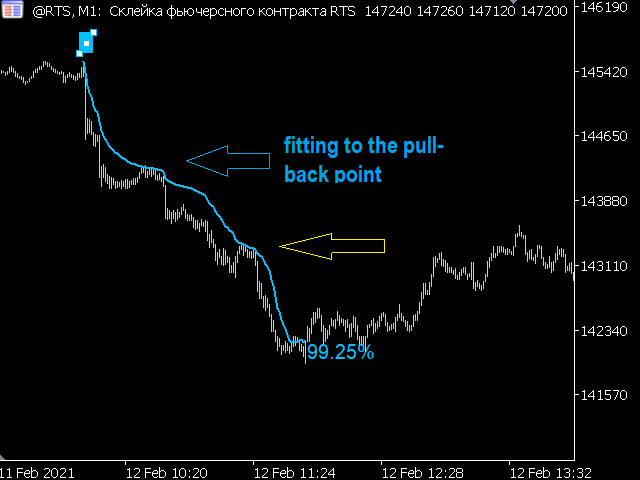
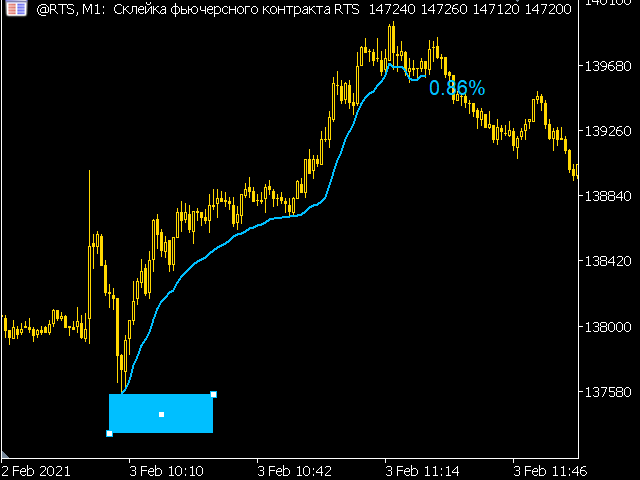
The indicator is designed to help the user to find the end point of a strong trending price movement. Important - END. Not start.
How the indicator works
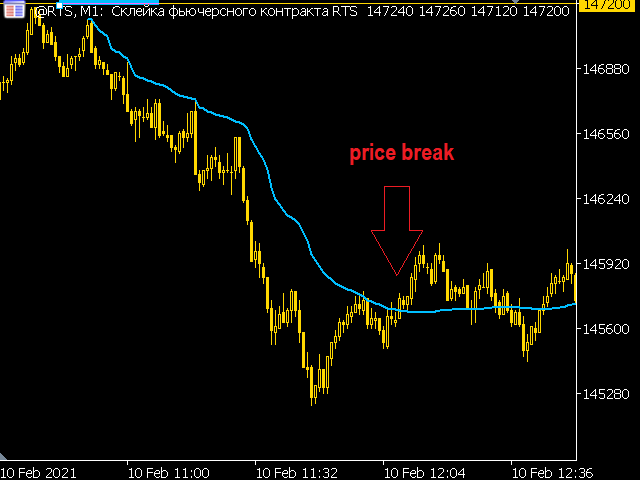
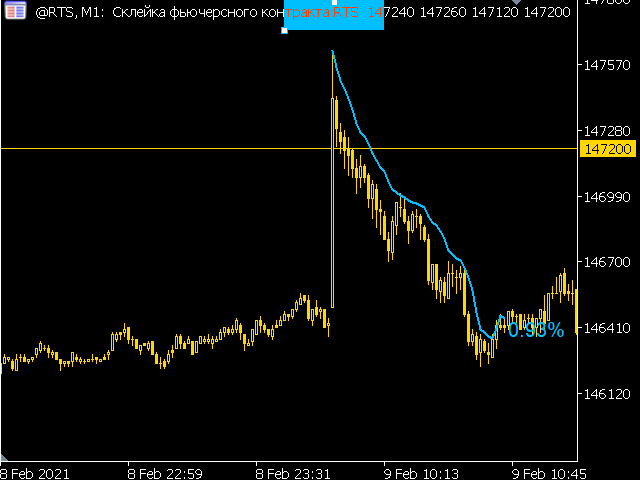
The first price impulse and its subsequent pullback form a certain "critical mass" which acts as "fuel" for further price movement. The production of this fuel indicates the potential end of the trend. Both volume and indicator calculated in a certain way from price data can be the fuel. The amount of "fuel" can be set by a user himself/herself so the curve should fit the first price pullback. Then we expect the end of the curve or its breakdown by the price. The indicator is intended to show a user potential exit points from the deal.
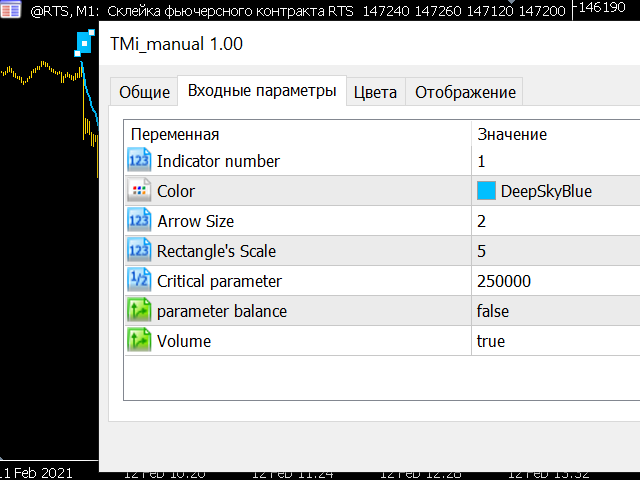
Settings
- Indicator number: If there are two or more indicators on the chart, each must have an individual number, otherwise indicators with the same numbers will start from the same point
- Critical parameter: the amount of "fuel", by changing which we put the curve on the first rollback of the movement
- Parameter balance: displaying the balance of the Critical parameter or the used amount
- Volume: use volume or analog obtained by converting price data to calculate Critical parameter. Without volume can be used on Forex and Crypto