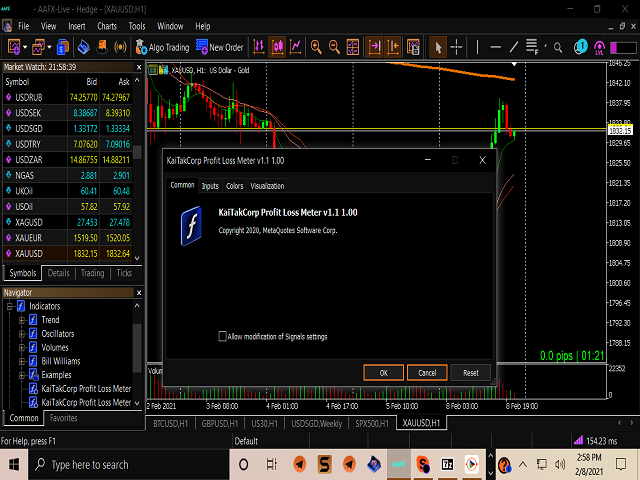
KaiTakCorp Profit Loss Meter
- インディケータ
- Kai Tak Corporation
- バージョン: 1.0
- アクティベーション: 5
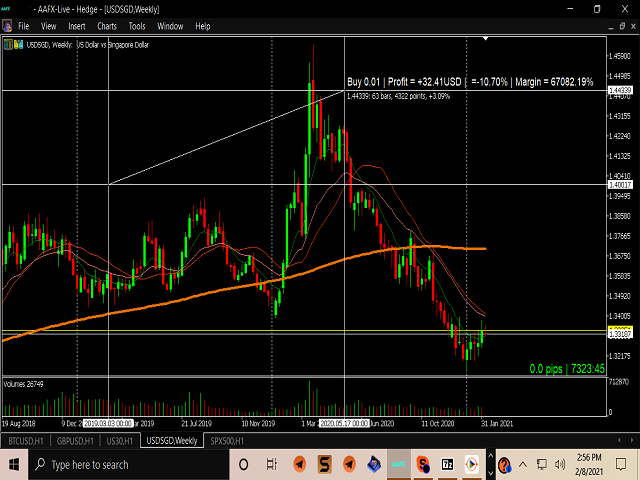
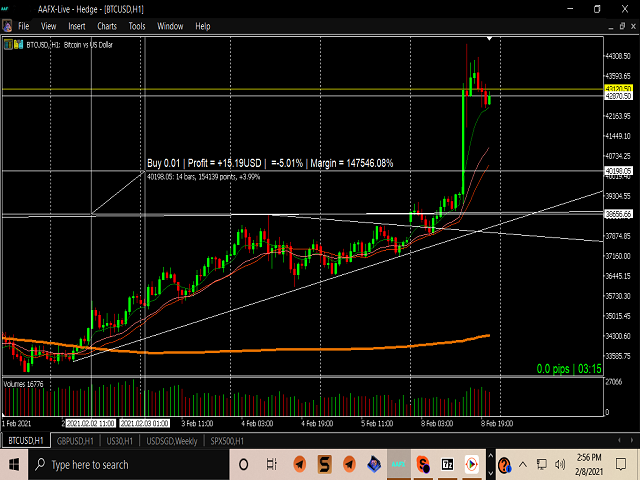
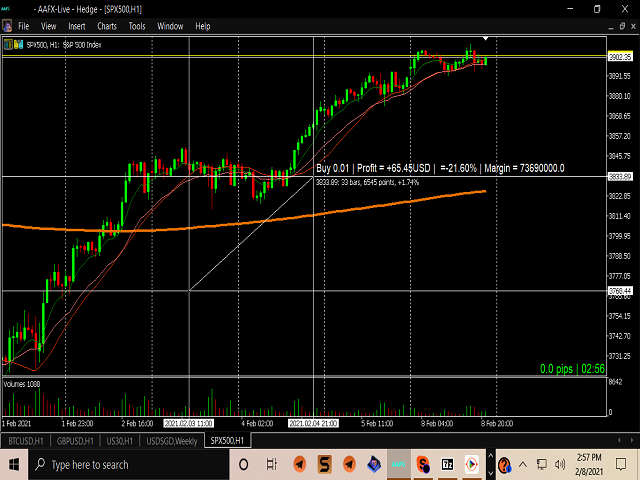
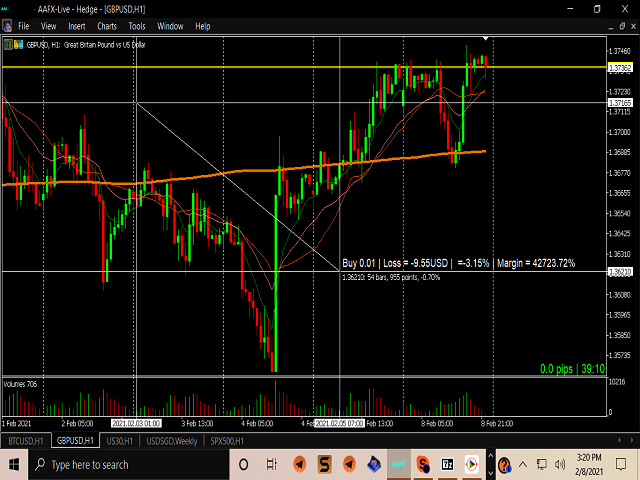
Profit Loss Meter
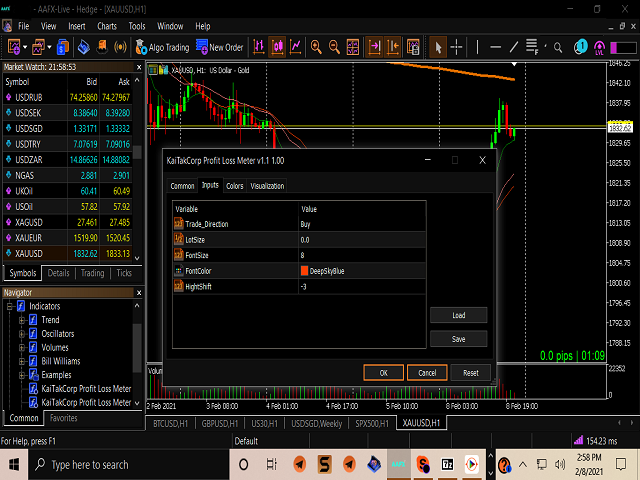
For the serious trader this fun easy to use indicator allows you to measure Profit and Loss of current, closed or future trades on your forex account chart. It measures Currency Pairs And Indices plus estimates margin levels at the trade close point. The Profit/Loss indicator is based on MT5 native Crosshair instrument. TO ACTIVATED USE "HOT KEYS" ctrl+f just as you would for activating the Crosshair. left click and hold then drag in the direction in which you would like to measure. The KaiTakCorp Profit/Loss Meter has the following inputs:
- Trade _ Direction = Buy/Sell
- LotSize = 0.1
- FontSize = 8
- FontColor = DeepSkyBlue
- HighShift = -3
I bought this Indicator, but it doesn’t work, show nothing on the chart. I try to contact, no answer at all.