バージョン 6.0
2024.06.05
Currency Strength Meter (New)
- Added the Currency Strength Meter on the trading dashboard.
- Used to identify the strength and weakness of each major currency in real time.
- Ability to customize and add additional instruments on the Currency Strength Meter.
- New input settings have been added to show/hide the Currency Strength Meter, and inputs for additional instruments.
Bug Fixes
- Minor bug fixes and performance improvements.
バージョン 5.0
2023.08.28
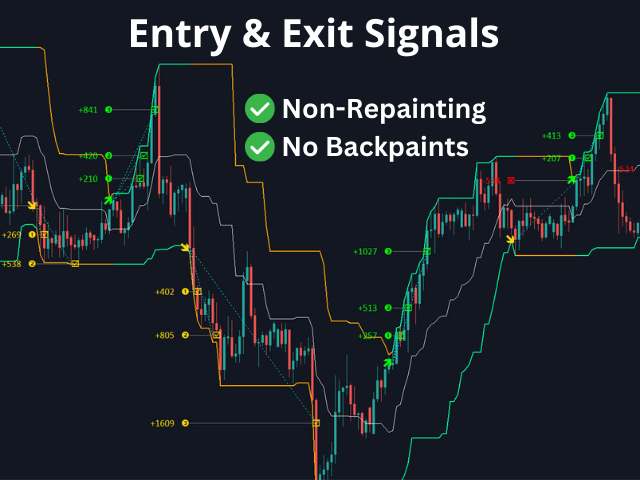
取引シグナル Confluence (新規)
- メイン取引シグナルへの追加の合流を有効にできるようになりました。
MACD Confluence (新規)
- MACD インジケーターを取引シグナルの合流点として有効にすることができます。
RSI Confluence (新規)
- RSI インジケーターを取引シグナルの合流点として有効にすることができます。
確率的合流点 (新規)
- トレードシグナルの合流点としてストキャスティクスインジケーターを有効にすることができます。
移動平均合流点 (新規)
- 取引シグナルの合流点として移動平均インジケーターを有効にすることができます。
二重移動平均合流点 (新規)
- 取引シグナルの合流点として二重移動平均戦略を有効にすることができます。
ダッシュボードの自動サイズ変更 (新機能)
- チャート上の利用可能なスペースに基づいて、ダッシュボード全体のサイズを手動で変更できるようになりました。
- ユーザーのマシンのさまざまな画面サイズに対応する、特小、小、通常、大、特大の新しいダッシュボード サイズ。
トレンドスキャナー (改良版)
- トレンド スキャナ ボックスの成功率とトレンド検出が向上しました。
- 不正確な成功率パーセンテージを示すトレンド スキャナー ボックスに関するいくつかの矛盾を修正しました。
バグの修正
- マイナーなバグ修正とパフォーマンスの改善。
バージョン 4.10
2023.01.16
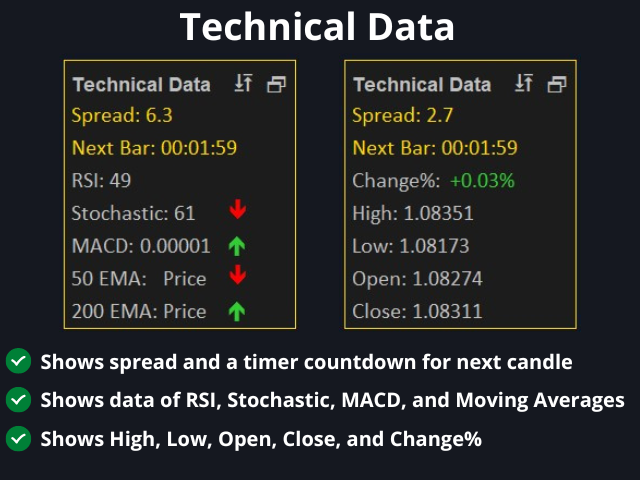
Technical Data Panel (New)
- Shows the data of technical indicators such as RSI, Stochastic, MACD, and Moving Averages
- Shows a timer countdown for the next bar on the current chart
- Shows the current high, low, open, close, and change percentage for the current chart
- Shows current spread of the pair
Watermark (New)
- Added ability to show a watermark of the pair name and timeframe on the chart
Screener (Updated)
- Updated to show a colored row separator for easier viewing
Chart Signals Visibility Icon (Updated)
- Updated the ability to show or hide the trading signals, buy & sell arrows, and trend lines on the current chart
Bug Fixes
- Fixed the Range meter not updating on pairs that have symbol suffix input
- Fixed a warning alert if the pair names do not match on the market watch window
- Fixed conflict when two or more instances are running on the same terminal
- Other bug fixes and improvements
バージョン 4.0
2023.01.04
New & Improved Indicator
- The entire indicator has been rebuilt from scratch with new features, improvements, and provides user a new enhanced experience compared to previous version
Forex Trading Sessions (New)
- Added Forex Market Session feature for New York, London, Tokyo, and Sydney Session
- Added range calculation in points for highs and lows for each trading session
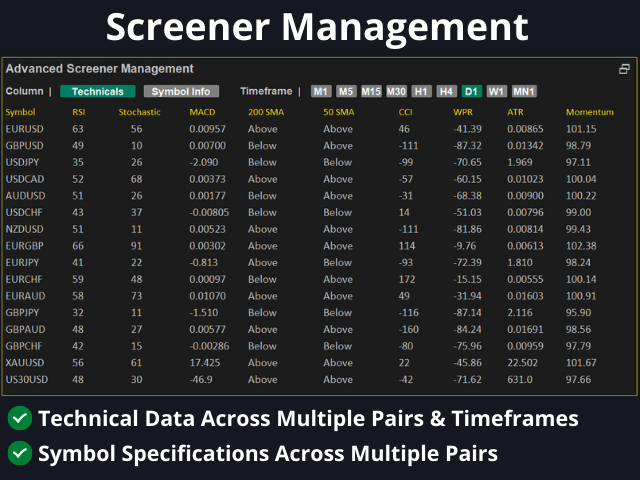
Screener (New)
- Shows data of various technical indicators of all pairs on the dashboard and timeframes
- Added technical data of indicators such as RSI, Stochastic, MACD, 200 SMA, 50 SMA, CCI, WPR, ATR, and Momentum
- Shows symbol information for all pairs on the dashboard such as Bid, Ask, Spreads, Swap Long, Swap Short, Min Lot, Lot Step, Max Lot and, Margin 1 Lot
Trend Scanner Data (New)
- The Trend Scanner Data allows you to change the data or number shown on each box of the trend scanner.
- The default data shows the success rate of the trading signals for each pair and timeframe
- You can change the data shown on the trend scanner to the bar age of the last signal, rating, total number of signals, total wins, total loss, RSI, and Stochastic
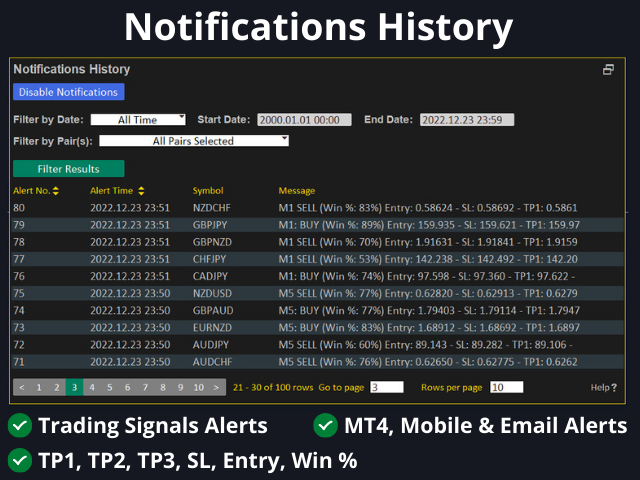
Notifications History (New)
- Notifications History shows you the history of the trading signal alerts sent out by the indicator
- You can filter the results by date and pairs
- Added pagination and sorting of data functionality
- You can enable/disable notifications directly on this dashboard
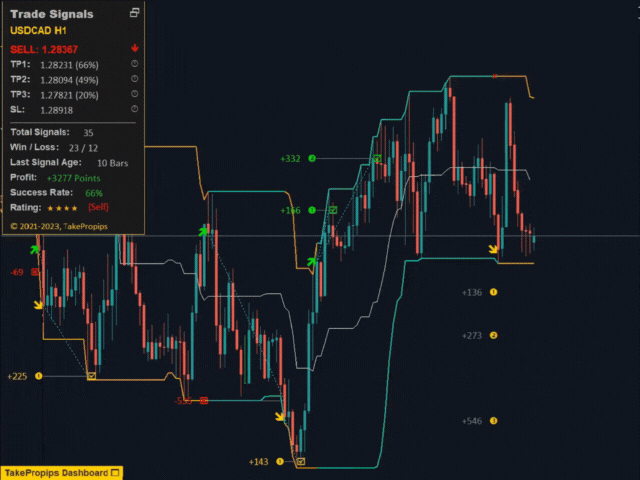
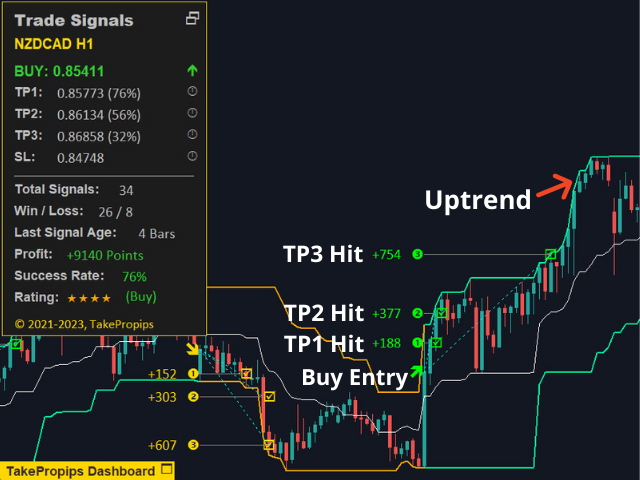
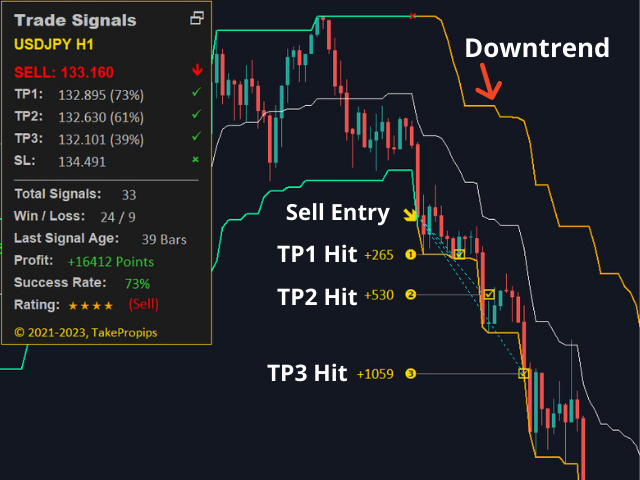
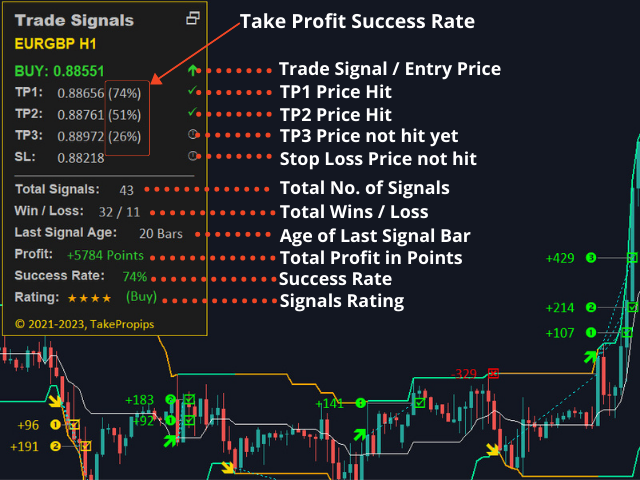
Trade Signals Panel (Updated)
- Added “Total Signals” which shows the total number of signals generated for a particular pair and timeframe
- Added “Last Signal Age” which shows the age of the last signal generated
Keyboard Shortcuts (New)
- You can now navigate through different pairs and timeframes on the dashboard using arrow keys and navigate through different dashboard panels using number keys
Chart Screenshot (New)
- Chart Screenshot gives you the ability to take a screenshot of the current chart with one click
- The file is saved on your Files folder on the MQL directory
Plus, Regular, & Mini Dashboard Sizes (New)
- You can change the size of the main dashboard depending on your preference
Price, Change %, & Spreads (New)
- The dashboard now shows the current price, daily change percentage, and spreads for each pair
Average Daily Range Column (New)
- Average Daily Range (ADR) is now displayed on the dashboard and it’s used to measure volatility of an asset
Range Meter Column (New)
- The Range meter shows visual representation of its current price relative to the highs and lows of the current daily candle
Toggle Sound / Alerts (New)
- You can now enable / disable alerts and sounds directly from the dashboard by clicking the bell and sound icon on the top left corner of the main dashboard
Dark Theme / Light Theme (New)
- You can switch between dark theme and light theme on the dashboard by clicking the eye icon on the top left corner of the main dashboard
Stop Loss Buffer ATR (New)
- You can further increase the size of your stop loss by using ATR as a buffer
- This is used mostly as a buffer when selecting support / resistance as your SL calculation
Chart Signals (Updated)
- Color green on chart signals represents buy signal and yellow represents sell signal
- Cleaned up chart signals and removed unnecessary arrows on chart
Other Bug Fixes
バージョン 3.1
2022.05.17
Fixed a duplicate error bug when loading the indicator from a template
バージョン 3.0
2022.01.31
Added new currency presets setting.
Added Take Profit 2 and Take Profit 3 values to trading signal alerts.
Added new setting to show the age of the last trading signal on the dashboard scanner.
Added ability to turn on/off trading signal alerts for specific timeframe(s).
Fixed incorrect stop loss value on trading signals alerts.
Added new setting to change font size of the dashboard panel.
Improved performance and overall responsiveness of the dashboard scanner.
バージョン 2.70
2021.08.03
Added ability to automatically calculate TP based on risk/reward ratio
Added ability to calculate TP & SL using fixed values
Added ability to calculate SL using the Donchian Channels Bands
Modified TP & SL Multipliers default values to reflect ATR
Performance improvements and code optimization
バージョン 1.40
2021.02.28
Ability to change line width and change the X & Y distance of the minimized scanner
バージョン 1.30
2021.02.22
Added ability to filter alerts by success rate
Added X Distance for panel and scanner. Also added ability to change button width
Added ability to modify the refresh rate of the scanner
Enhancements of the Donchian strategy to better reflect the trend of the market
バージョン 1.20
2021.01.19
Added ability to manually adjust the Y-distance from the top corner of the Dashboard Panel & Scanner. The Y-Distance for panel will automatically adjust if One-Click Trading is shown on the chart.
バージョン 1.10
2021.01.15
Code enhancements for faster performance


the indicator work's great it helps me look for movement in the market i am sorry for the confusion with the application of the indicator great work.