• 概要
  • レビュー (2)
  • コメント

MaxlotTomson

5
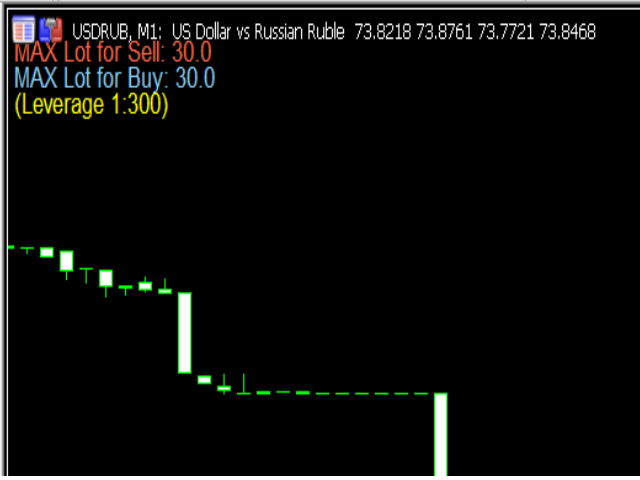
Good afternoon. Today we offer the maxlottomson indicator to determine the maximum volume that you can put up for purchase or sale, if you look at your deposit level. This indicator is convenient to use for News trading, when you need to determine the entry point on a high-speed movement and calculate the risk level as a percentage of the deposit, the maxlottomson indicator shows the maximum value of the LOT volume for your deposit that you can use for trading.


レビュー 2
mosxdio
44
mosxdio 2021.04.14 15:56 
 

Useful!

Aleksandr Tamonin
4109
Aleksandr Tamonin 2021.01.12 18:20 
 

Очень полезный информационный индикатор! Спасибо автору!

おすすめのプロダクト
ピボットポイントフィボRSJは、フィボナッチレートを使用してその日のサポートラインとレジスタンスラインを追跡するインジケーターです。 この壮大な指標は、フィボナッチレートを使用してピボットポイントを通じて最大7レベルのサポートとレジスタンスを作成します。 価格がこのサポートとレジスタンスの各レベルを尊重する方法は素晴らしいです。そこでは、オペレーションの可能な入口/出口ポイントを認識することができます。 特徴 最大7レベルのサポートと7レベルの抵抗 レベルの色を個別に設定します 入力 ピボットタイプ ピボットフィボRSJ1 =フィボ比1の計算 ピボットフィボRSJ2 =フィボ比2の計算 ピボットフィボRSJ3 =フィボ比3の計算 ピボットフィボクラシック=クラシックピボット計算 最小ピボットレベル ピボット3レベル ピボット4レベル ピボット5レベル ピボット6レベル ピボット7レベル それでも質問がある場合は、ダイレクトメッセージで私に連絡してください: https://www.mql5.com/ja/users/robsjunqueira/
FREE
Cybertrade Keltner Channels - MT5 Created by Chester Keltner, this is a volatility indicator used by technical analysis. It is possible to follow the trend of financial asset prices and generate support and resistance patterns. In addition, envelopes are a way of tracking volatility in order to identify opportunities to buy and sell these assets. It works on periods longer than the period visible on the chart. All values ​​are available in the form of buffers to simplify possible automations.
FREE
This indicator is stand alone version from  MP Pivot Levels  (All in one) containing Demark's Pivots. Calculations:     PP = X / 4     R1 = X / 2 - LOWprev     S1 = X / 2 - HIGHprev Uses: When the pair currency price may change the direction of movement. Possible constraints of support and resistance that creates plateaus for the currency pair prices. Tendency identification by comparing the present prices according to current day's pivot point and also the prior day's pivot points. ___________
FREE
This indicator is designed to detect high probability reversal patterns: Double Tops/Bottoms with fake breakouts . This is the FREE version of the indicator: https://www.mql5.com/en/market/product/29957 The free version works only on EURUSD and GBPUSD! Double top and bottom patterns are chart patterns that occur when the trading instrument moves in a similar pattern to the letter "W" (double bottom) or "M" (double top). The patterns usually occur at the end of a trend and are used to signal tren
FREE
価格波形パターン MT5へようこそ --(ABCD パターン)-- ABCD パターンは、テクニカル分析の世界で強力で広く使用されている取引パターンです。 これは、トレーダーが市場での潜在的な売買機会を特定するために使用する調和的な価格パターンです。 ABCD パターンを使用すると、トレーダーは潜在的な価格変動を予測し、いつ取引を開始および終了するかについて十分な情報に基づいた決定を下すことができます。 EA バージョン:     Price Wave   EA MT5 MT4バージョン:   Price Wave Pattern MT4 特徴 :  ABCDパターンの自動検出。 強気パターンと弱気パターン。  任意のシンボルと任意の時間枠で機能します。 主要なレベルと価格目標。 カスタマイズ可能な設定と繊維レベルの調整。 アラートと通知。 今後  さらに多くの 機能が追加される  予定です 。
FREE
Bounce Zone MT5
Nguyen Thanh Cong
4.14 (7)
Introduction The Bounce Zone indicator is a cutting-edge non-repainting technical tool built to identify key areas on the price chart where market sentiment is likely to cause a significant price reversal. Using advanced algorithms and historical price data analysis, this indicator pinpoints potential bounce zones. Combined with other entry signal, this indicator can help forex traders place the best trades possible Signal A possible buy signal is generated when price is in the green zo
FREE
Force Numbers
Flavio Javier Jarabeck
Several assets in several markets have the behavior of using specific numbers as Force Numbers, where support, resistance and price thrust is created. Let this indicator draw those levels of support and resistance for you. You can also stack it to show different level of Prices! This technique is being used by Tape Readers and Order Flow traders all over the world for a long time. Give it a try. Challenge yourself to study new ways of Price Action! SETTINGS What Price reference to use in th
FREE
Pivot MT5
Dmitrij Isaenko
5 (1)
The indicator draws daily support and resistance lines on the chart, as well as the Pivot level (reversal level). Adapted to work in MT5 The standard timeframe for calculating support and resistance levels is D1. You can choose other timeframes according to your strategy (for example, for M1-M15, the optimal timeframe for calculations is H1) The function for calculating support and resistance levels has been updated; in this calculation option, fibonacci levels are taken into account, res
FREE
This is a Price Projection  for Current Candle from Time Frame M15 To Weekly, It's shows Market Trends Teji (Bullish) Or Mandi (Berries). It's Show Teji High & Low for Bullish Market and Mandi High & Low for Berries Market. We can Plan Our Trade in Well Advance for our Current Open Trade. It's Generate New Data for Every New Candle. You are requested to Please Test it with demo Ac before Use in Real Trade. Please Save it to your Mql\Indicator folder and attache to your chart. if any quay Please
FREE
Tired of plotting trendlines? The PZ TrendLines MT5 indicator applies a mechanical approach to the construction of trend lines for you!  [ Installation Guide | Update Guide | Troubleshooting | FAQ | All Products ] It can draw up to 18 trendlines Trendlines can be optionally based on fractals Each line represents a breakout level Each trendline can be broken or rejected Configurable amount of lines Configurable colors Support I am happy to provide free products but given my limited time, they com
FREE
Daily session open lines shows the traders three important trading session opens. By default it is set up to show you: Zero GMT Open Line London Open Session Line New York Open Session Line The default times are set according to GMT+2 and as such you are able to change and customise according to your specific time zone. The Indicator is usefull specially for the trader who trades the London and NewYork sessions.
FREE
Important Lines
Terence Gronowski
4.88 (26)
This indicator displays Pivot-Lines, preday high and low, preday close and the minimum and maximum of the previous hour. You just have to put this single indicator to the chart to have all these important lines, no need to setup many single indicators. Why certain lines are important Preday high and low : These are watched by traders who trade in a daily chart. Very often, if price climbs over or falls under a preday low/high there is an acceleration in buying/selling. It is a breakout out of
FREE
A   comprehensive tool for determining the levels of support, resistance, reversals in relation to trading sessions. The indicator's thesis can be expressed as follows: "Support and resistance levels are undoubtedly formed by the psychological barriers of market participants, and influence the further behavior of the price. But these barriers are different for different groups of   traders ( One man's meat is another man's poison ) and  can be grouped by territory or by the trading time ". Follo
FREE
Fair Value Gaps (FVG) and Liquidity Voids are price ranges you can exploit for better entries and exits on your trades. They're similar concepts, so let's look at them from the top and break it down. Think of FVG and Liquidity voids as soft-spots in the market. They are paths of least resistance. That doesn't mean price will go through them, but price could go through them more easily.  To find and locate it is easy but tidiest to repeat the same thing all over again. This helps to boost your
FREE
The Penta-O is a 6-point retracement harmonacci pattern which usually precedes big market movements. Penta-O patterns can expand and repaint quite a bit. To make things easier this indicator implements a twist: it waits for a donchian breakout in the right direction before signaling the trade. The end result is an otherwise repainting indicator with a very reliable trading signal. The donchian breakout period is entered as an input. [ Installation Guide | Update Guide | Troubleshooting | FAQ | A
FREE
"Hunttern harmonic pattern finder" base on the dynamic zigzag with the notification and prediction mode This version of the indicator identifies 11 harmonic patterns and predicts them in real-time before they are completely formed. It offers the ability to calculate the error rate of Zigzag patterns depending on a risk threshold. It moreover sends out a notification once the pattern is complete. The supported patterns: ABCD BAT ALT BAT BUTTERFLY GARTLEY CRAB DEEP CRAB CYPHER SHARK THREE
FREE
Free automatic Fibonacci is an indicator that automatically plots a Fibonacci retracement based on the number of bars you select on the BarsToScan setting in the indicator. The Fibonacci is automatically updated in real time as new highest and lowest values appears amongst the selected bars. You can select which level values to be displayed in the indicator settings. You can also select the color of the levels thus enabling the trader to be able to attach the indicator several times with differe
FREE
RoundNumber MT5
Mohamad Zulhairi Baba
5 (3)
RoundNumbers  indicator is a simple and powerful psychological price levels. Trader usually use these levels as a  Support and Resistance (SnR). Indicator Input: Levels  - Numbers of levels drawn on chart.  Default 30 levels. BoxSize  - Box size drawn on each levels, indicate buffers around levels.  Default value 1pips (10point) above and below each levels. ZoneSize  - Distance between each levels,  default value 10pips (100point). Style & Colours  - User inputs customization. For MT4 version, p
FREE
This indicator studies price action as an aggregation of price and time vectors, and uses the average vector to determine the direction and strength of the market. This indicator highlights the short-term directionality and strength of the market, and can be used to capitalize from short-term price movements by trading breakouts or binary options.  [ Installation Guide | Update Guide | Troubleshooting | FAQ | All Products ] Find market direction easily Confirm with breakouts or other indicators
FREE
This indicator is an automated version of the Fibonacci retracement (Fib) indicator. Deciding the best areas to use when drawing the fib can be tricky and this  indicator was made with that in mind. When you drop it on the chart it will automatically choose the best points to draw the fib with, but in case you aren't satisfied with those regions, you can adjust it as you wish.
FREE
This indicator is very useful for day traders or short term traders. (MT5 version) No need to calculate the number of pips manually, just look at the chart and you will see the Virtual Take Profit / Virtual Stop Loss target line and evaluate whether the entry point is feasible to reach the intended target or not. Enter the intended   Take Profit / Stop Loss   pips for your trade. The indicator will display   Virtual Take Profit / Virtual Stop Loss   lines for you to easily see if the target i
FREE
Functional in the Forex market. Functional on the B3 market - Bolsa Brasil Balcão. Motivation The Price Guide indicator is a tool that helps you insert support and resistance points at the chosen price and in the quantity you want, it depends on the agility of its configuration. This DEMO version will work on the Meta Trader 5 Demo account and Strategy Tester. Get the Full version that works with a Real account click: https://www.mql5.com/pt/market/product/111897 Operation The methodology publi
FREE
This indicator finds Three Drives patterns. The Three Drives pattern is a 6-point reversal pattern characterised by a series of higher highs or lower lows that complete at a 127% or 161.8% Fibonacci extension. It signals that the market is exhausted and a reversal can happen. [ Installation Guide | Update Guide | Troubleshooting | FAQ | All Products ] Customizable pattern sizes Customizable colors and sizes Customizable breakout periods Customizable 1-2-3 and 0-A-B ratios It implements visua
FREE
毎日特定のローソク足で動くPIVOTを何度探したことでしょう。 多くのトレーダーは、マーケットが開いてから30分後、正午12時など、毎日特定の時刻を基準にして、その日のトレンドの方向性を推し量ることを好みます。 このインディケータでは、特定の時間(時、分)を指定し、その時間から翌日までのピボットを同時にプロットすることができます。その特定のローソク足/時間に基づき、中央値、最大値、最小値、サポ ート、レジスタンスの5本のラインが表示されます。 選択した時間がPERIODの制限外(M5タイムフレームの10:12など)である場合、この値は最も近いローソク足の時間に切り上げられます。さらに、ユーザーはすべての線のスタイル、色、幅を設定することができます。 これで良いトレードができることを願っています。 また、時間範囲に基づくPIVOTが必要な場合は、 他の製品をご覧ください 。
FREE
ContiStat restricted - Free DEMO version of the ContiStat indicator Free version of the indicator is ment as DEMO of full paid version. Full functionality is available, however The indicator work only on M30 chart period . Find the ContiStat indicator for full functionality Brief description The ContiStat indicator calculate statistic frequency of green (up) and red (down) movement in the chart and determine movement dynamics (silver curve). There are two key parameters to understand the Conti
FREE
チャート上にフィボナッチレベルを手動で描画することにうんざりしていませんか?取引における主要なサポートとレジスタンスのレベルを特定する便利で効率的な方法をお探しですか?これ以上探さない! 自動 フィボナッチ レベル を実行する究極の MetaTrader 5 インジケーターである DrawFib Pro の紹介   チャート上に描画し、これらのレベルを突破したときにタイムリーにアラートを提供します。 DrawFib Pro を使用すると、取引戦略を強化し、時間を節約し、より多くの情報に基づいた意思決定を行うことができます。 私のフィボナッチベースのインジケーター:   Advanced Gartley Pattern MT5   ||    Price Wave Pattern MT5 主な特徴: 自動 フィボナッチ描画. カスタマイズ可能な パラメータ . 正確 で 信頼性. リアルタイム アラート. ユーザー フレンドリーな インターフェイス . DrawFib Pro は、チャート上でフィボナッチを自動描画するための効率的で信頼性が高く、使いやすい方法を求めるトレーダーにとって
FREE
TG Ponto de Cobertura (Coverage Trade) This Indicator checks your trading results on the day relative to the asset on the chart and adds a line at the price corresponding to the coverage point for the open position, considering the entry price and lot size. The coverage point will be recalculated after new entries, based on the average price of the open operation and the lot size. If the result for the day is zero, a line will be displayed at the price of the current trade. If the day's r
FREE
Santa Donchian
Marco Aurelio Cestari
4.17 (6)
Santa Donchian Indicator  is an efficient way to detect support, resistence and break outs in any market. The Donchian channel measures the high and the low of a previously defined range.  Typically, a trader would look for a well-defined range and then wait for the price to break out to either one side for a trade entry trigger. Advantages Never repaints, never backpaints, never recalculates. Works in all symbols and all timeframes. Perfect trend filter for any strategy or expert advisor. Fu
FREE
Just another   Auto Fibonacci Retracement indicator . However, this is the most   Flexible   &   Reliable   one you can find for FREE. If you use this indicator and you like it, please leave a review/comment. If you are looking for a more advanced Fibo indicator, check this Free  Trend-Based Fibo indicator . ### FEATURES ### Auto-calculate up to 7 Fibonacci levels on your customized frame. Adjust levels as your need. Use High/Low price or  Open/Close price to calculate. Freeze the levels and don
FREE
インディケータはチャート上にラウンドレベルを示します。 それらは、心理的、銀行的、または主要なプレーヤーレベルとも呼ばれます。 これらのレベルでは、強気と弱気の間に真の戦いがあり、多くの注文が蓄積され、ボラティリティの増加につながります。 インジケーターは、任意の楽器と時間枠に自動的に調整されます。 レベル80を突破してテストすると、購入します。レベル20を突破してテストすると、販売されます。ターゲットは00です。 注意。強力なサポートとレジスタンスレベルのため、価格は00レベルをわずかに下回る可能性があります。 入力パラメータ 。 Bars Count - 線の長さ 。 Show 00 Levels - 00レベルを表示するかしないか 。 Show 10, 90 Levels 。 Show 20, 80 Levels 。 Show 30, 70 Levels 。 Show 40, 60 Levels 。 Show 50 Levels 。 N Lines - チャートのレベル数を制限するパラメーター 。 Distance 00 Levels - レベル間の距離(自動または手動
FREE
このプロダクトを購入した人は以下も購入しています
まず第一に、この取引インジケーターは再描画されず、再描画されず、遅延しないことを強調する価値があります。これにより、手動取引とロボット取引の両方に理想的なものになります。 ユーザーマニュアル:設定、入力、戦略。 アトミックアナリストは、価格の強さとモメンタムを利用して市場でより良いエッジを見つけるためのPA価格アクションインジケーターです。ノイズや誤ったシグナルを除去し、取引ポテンシャルを高めるための高度なフィルターを備えています。複雑なインジケーターの複数のレイヤーを使用して、アトミックアナリストはチャートをスキャンし、複雑な数学的計算をシンプルなシグナルと色に変換します。これにより、どのような初心者トレーダーでも理解して使用し、一貫した取引の決定を行うことができます。 「アトミックアナリスト」は、新規および経験豊富なトレーダー向けにカスタマイズされた包括的な取引ソリューションです。プレミアムインジケーターとトップノッチの機能を1つの取引戦略に組み合わせ、すべてのタイプのトレーダーにとって汎用性のある選択肢にします。 デイリートレーディングとスキャルピング戦略:高速で正確な
まず第一に、このトレーディングシステムがノンリペイント、ノンリドロー、ノンラグのインジケーターであることを強調する価値がある。これにより、手動取引とロボット取引の両方に理想的なものになっています。 オンラインコース、マニュアル、プリセットのダウンロード。 「スマートトレンドトレーディングシステム MT5」は、新規および経験豊富なトレーダー向けにカスタマイズされた包括的なトレーディングソリューションです。10以上のプレミアムインジケーターを組み合わせ、7つ以上の堅実なトレーディング戦略を備えており、多様な市場状況に対応する多目的な選択肢となっています。 トレンドフォロー戦略:トレンドを効果的に乗り越えるための正確なエントリーとストップロス管理を提供します。 リバーサル戦略:潜在的なトレンドの反転を特定し、トレーダーがレンジ相場を活用できるようにします。 スキャルピング戦略:高速で正確なデイトレードおよび短期取引のために設計されています。 安定性:すべてのインジケーターはノンリペイント、ノンリドロー、ノンラグであり、信頼性の高いシグナルを保証します。 カスタマイズ:個々の取引の嗜好に合わせ
Quantum Trend Sniper
Bogdan Ion Puscasu
4.91 (43)
ご紹介   クォンタム トレンド スナイパー インジケーターは 、トレンド反転を特定して取引する方法を変革する画期的な MQL5 インジケーターです。 13年以上の取引経験を持つ経験豊富なトレーダーのチームによって開発されました。     クォンタムトレンドスナイパーインジケーター   は、非常に高い精度でトレンドの反転を識別する革新的な方法で、あなたのトレーディングの旅を新たな高みに押し上げるように設計されています。 ***Quantum Trend Sniper Indicatorを購入すると、Quantum Breakout Indicatorを無料で入手できます!*** クォンタム ブレイクアウト インジケーターは、トレンドの反転を特定するとアラートを発し、矢印を示し、3 つのテイクプロフィットレベルを提案します。 初心者トレーダーにもプロのトレーダーにも適しています。 量子EAチャネル:       ここをクリック MT4のバージョン:       ここをクリック 推奨事項: 期間:すべての時間枠。最良の結果を得るには、M
mql5と Telegramの モーニング・ブリーフィングで、詳細とスクリーンショットを含む毎日のマーケット・アップデートをご覧 ください! FX Power MT5 NGは 、長年の人気を誇る通貨強度計FX Powerの次世代モデルです。 この次世代ストレングスメーターは何を提供するのでしょうか?初代FXパワーの魅力すべて プラス GOLD/XAUの強さ分析 より正確な計算結果 個別に設定可能な分析期間 カスタマイズ可能な計算上限値により、さらに優れたパフォーマンスを実現 もっと見たい人のための特別なマルチインスタンス設定 すべてのチャートでお好みの色を無限に設定可能 数え切れないほどの通知オプションにより、重要なことを見逃すことはありません。 Windows 11とmacOSのスタイルで角を丸くした新しいデザイン 魔法のように動くインジケーターパネル FXパワーの主な機能 すべての主要通貨の強さの完全な履歴 すべての時間枠における通貨の強さの履歴 すべてのブローカーとチャートで同一の計算結果 100%信頼できるリアルタイム計算 -> リペイントなし ドロップダウン・リストから
Reversal First Impulse levels (RFI)      INSTRUCTIONS        RUS       -       ENG              R ecommended to use with an indicator   -   TREND PRO -  Version MT4                 A key element in trading is zones or levels from which decisions to buy or sell a trading instrument are made. Despite attempts by major players to conceal their presence in the market, they inevitably leave traces. Our task was to learn how to identify these traces and interpret them correctly. Main functions:: Di
トレンド スクリーナー インジケーターでトレンド取引の力を解き放ちます。ファジー ロジックと複数通貨システムを活用した究極のトレンド取引ソリューションです。 ファジー ロジックを活用した革新的なトレンド インジケーターである Trend Screener を使用して、トレンド取引を向上させます。 これは、13 を超えるプレミアム ツールと機能、および 3 つの取引戦略を組み合わせた強力なトレンド追跡インジケーターであり、Metatrader をトレンド アナライザーにする多用途の選択肢となります。 期間限定オファー : トレンド スクリーナー インジケーターは、わずか 50 ドルで生涯ご利用いただけます。 (元の価格 125$ ) (オファー延長) Trend Screener の 100% 非再描画精度の揺るぎない精度を体験して、取引の決定が過去の価格変動の影響を受けないようにしてください。 マルチタイムフレームおよびマルチ通貨機能の多用途性を解放し、比類のない自信を持って外国為替、商品、暗号通貨、インデックスの世界を取引できるようにします。 Trend Screener の包括的な
まず第一に、この取引ツールはノンリペイント、ノンリドロー、ノンラグの指標であり、プロの取引に理想的ですことを強調する価値があります。 オンラインコース、ユーザーマニュアル、デモ。 スマートプライスアクションコンセプトインジケーターは、新米から経験豊富なトレーダーまで、非常 に強力なツールです。Inner Circle Trader AnalysisやSmart Money Concepts Trading Strategiesなど、20以上の有用な指標を1つに組み合わせています。このインジケーターはスマートマネーコンセプトに焦点を当て、大手機関の取引方法を提供し、彼らの動きを予測するのに役立ちます。 特に、流動性分析に優れており、機関がどのように取引しているかを理解しやすくしています。市場のトレンドを予測し、価格の動きを慎重に分析するのに優れています。機関の戦略とトレードを合わせることで、市場の動向についてより正確な予測ができます。このインジケーターは多目的であり、市場構造を分析し、重要な注文ブロックを特定し、さまざまなパターンを認識するのに優れています。 このインジ
TPSpro TRENDPRO  - is a trend indicator that automatically analyzes the market and provides information about the trend and each of its changes, as well as giving signals for entering trades without redrawing! The indicator uses each candle, analyzing them separately. referring to different impulses - up or down impulse. Exact entry points into transactions for currencies, crypto, metals, stocks, indices!  -  Version MT4               DETAILED DESCRIPTION               R ecommended to use with
Gold Stuff mt5
Vasiliy Strukov
4.89 (176)
Gold Stuff mt5 は、金専用に設計されたトレンド指標であり、あらゆる金融商品にも使用できます。 インジケーターは再描画せず、遅れません。 推奨時間枠 H1. 設定と個人的なボーナスを得るために、購入後すぐに私に連絡してください!  トレンド スキャナーの強力なサポートを利用して、無料のインジケーターを入手し、プライバシーを守ります。あーみー!   設定 矢印を描く - オンオフ。 チャートに矢印を描く。 アラート - 可聴アラートのオンオフ。 メール通知 - オンオフ。 電子メール通知。 プチ通知 - オンオフ。 プッシュ通知。 次に、色域を調整します。 Gold Stuff mt5 は、金専用に設計されたトレンド指標であり、あらゆる金融商品にも使用できます。 インジケーターは再描画せず、遅れません。 推奨時間枠 H1. 設定と個人的なボーナスを得るために、購入後すぐに私に連絡してください!   設定 矢印を描く - オンオフ。 チャートに矢印を描く。 アラート - 可聴アラートのオンオフ。 メール通知 - オンオフ。 電子メール通知。 プチ通
WHY IS OUR FXACCCURATE LS MT5 THE PROFITABLE ? PROTECT YOUR CAPITAL WITH RISK MANAGEMENT Gives entry, stop and target levels from time to time. It finds Trading opportunities by analyzing what the price is doing during established trends. POWERFUL INDICATOR FOR A RELIABLE STRATEGIES We have made these indicators with a lot of years of hard work. It is made at a very advanced level. Established trends provide dozens of trading opportunities, but most trend indicators completely ignore them!
ICT, SMC, SMART MONEY CONCEPTS, SMART MONEY, Smart Money Concept, Support and Resistance, Trend Analysis, Price Action, Market Structure, Order Blocks, BOS/CHoCH,   Breaker Blocks ,  Momentum Shift,   Supply&Demand Zone/Order Blocks , Strong Imbalance,   HH/LL/HL/LH,    Fair Value Gap, FVG,  Premium  &   Discount   Zones, Fibonacci Retracement, OTE, Buy Side Liquidity, Sell Side Liquidity, BSL/SSL Taken, Equal Highs & Lows, MTF Dashboard, Multiple Time Frame, BigBar, HTF OB, HTF Market Structure
これはMT5のインジケーターで、再描画なしで取引に参入するための正確なシグナルを提供します。 外国為替、暗号通貨、金属、株式、インデックスなど、あらゆる金融資産に適用できます。かなり正確な見積もりを提供し、取引を開始して終了するのに最適な時期を教えてくれます。1つのシグナルを処理しただけでインジケーターの元が取れた例の 動画 (6:22)をご覧ください。Entry PointsPro インジケーターの助けを借りたほとんどのトレーダーの最初の1週間の結果が改善しています。 Telegramグループ に登録してください。Entry Points Proインジケーターのメリットは次の通りです。 再描画のないエントリーシグナル 再描画されるインジケーターでは一度表示されたシグナルが削除されて大きな金銭的損失につながることがありますが、これと異なり、表示されて確認されたシグナルは消えることがありません。 エラーなしの取引開始 インジケーターアルゴリズムによって取引を開始する(資産を売買する)理想的な瞬間を見つけることができます。それを使用するすべてのトレーダーの成功率が向上します。
AW Trend Predictor MT5
AW Trading Software Limited
4.78 (58)
1 つのシステムでのトレンド レベルとブレイクダウン レベルの組み合わせ。高度なインジケーター アルゴリズムは、市場のノイズをフィルター処理し、トレンド、エントリー ポイント、および可能なエグジット レベルを決定します。インジケーターシグナルは統計モジュールに記録されるため、最適なツールを選択してシグナル履歴の有効性を示すことができます。この指標は、テイクプロフィットとストップロスのマークを計算します。 マニュアルと説明書 ->   ここ / MT4 バージョン ->   ここ インジケーターで取引する方法: Trend Predictor での取引は、たった 3 つの簡単なステップです。 ステップ 1 - ポジションを開く 70% 以上の成功率で買いシグナルが受信されました ステップ 2 - ストップロスの決定 逆信号でトランクを選択 ステップ 3 - テイクプロフィット戦略の定義 戦略 1: TP1 に到達したらポジション全体をクローズする 戦略 2: TP1 に達した時点でポジションの 50% をクローズし、TP2 に達した時点で残りの 50% をクローズします。 戦略 3:
The Volume by Price Indicator for MetaTrader 5 features Volume Profile and Market Profile TPO (Time Price Opportunity). Volume and TPO histogram bar and line charts. Volume Footprint charts. TPO letter and block marker collapsed and split structure charts. Session filtering and grouping. Static, dynamic and flexible range segmentation and compositing methods with relative and absolute visualizations. Graphical layering, positioning and styling options to suit the user's analytic and aesthetic n
Quantum平均足PRO のご紹介 市場のトレンドに対する明確な洞察を提供するように設計された平均足キャンドルは、ノイズを除去し、誤ったシグナルを排除する能力で知られています。混乱を招く価格変動に別れを告げ、よりスムーズで信頼性の高いチャート表現を導入しましょう。 Quantum Heiken Ashi PRO を真にユニークなものにしているのは、従来のローソク足データを読みやすい色のバーに変換する革新的なフォーミュラです。赤と緑のバーはそれぞれ弱気トレンドと強気トレンドをエレガントに強調し、潜在的なエントリーポイントとエグジットポイントを驚くほど正確に見つけることができます。 量子EAチャネル:       ここをクリック MT4のバージョン:       ここをクリック この注目すべき指標には、いくつかの重要な利点があります。 明確性の向上: 価格変動を平滑化することで、平均足バーは市場トレンドをより明確に表現し、有利な取引機会を特定しやすくします。 ノイズの削減: 誤ったシグナルを引き起こすことが多い不安定な価格変動に別れを告げます。 Quantum Heik
FX Volume MT5
Daniel Stein
4.94 (17)
mql5と Telegramの モーニング・ブリーフィングで、詳細とスクリーンショットを含む毎日のマーケット・アップデートをご覧 ください! FX Volumeは、ブローカーの視点から市場のセンチメントをリアルに洞察する、最初で唯一の出来高インジケーターです。 ブローカーのような機関投資家が外国為替市場でどのようなポジションをとっているか、COTレポートよりもはるかに速く、素晴らしい洞察を提供します。 この情報をチャート上で直接見ることは、あなたの取引にとって真のゲームチェンジャーであり、画期的なソリューションです。 以下のようなユニークなマーケットデータ洞察から利益を得てください。 比率は 、通貨のロングポジションとショートポジションの比率をパーセントで表示します。 比率の変化は 、選択した期間内のロング比率とその変化率を表示します。 Volumes Totalは 、通貨の取引量(ロングとショート)の合計をロット単位で表示します。 Volumes Long :全通貨のロングポジションの取引量を表示します。 Volumes(ショート )は、全通貨のショートポジションの取引量を表示
現在33%オフ 初心者にもエキスパートトレーダーにも最適なソリューション このインジケーターは独自の機能と新しい公式を多数内蔵しており、ユニークで高品質かつ手頃な取引ツールです。このアップデートでは、2つの時間枠ゾーンを表示できるようになります。より長いTFだけでなく、チャートTFとより長いTF(ネストゾーンを表示)の両方を表示できます。すべてのSupply Demandトレーダーの皆さんのお気に召すはずです。:) 重要情報の公開 Advanced Supply Demandの可能性を最大化するには、 https://www.mql5.com/ja/blogs/post/720245 にアクセスしてください。   エントリーまたはターゲットの正確なトリガーポイントを正確に特定できれば取引がどのように改善されるか想像してみてください。新しい基盤となるアルゴリズムに基づいて構築されているため、買い手と売り手の間の潜在的な不均衡をさらに簡単に特定できます。これは、最も強い需要と供給のゾーンと、過去のパフォーマンス(古いゾーンを表示)がグラフィカルに表現されるためです。これらの機能は、最適
Easy BySell is a market indicator for opening and closing positions. It becomes easy to track market entries with the alerts. It indicates the trend reversal points when a price reaches extreme values and the most favorable time to enter the market. My other products  with its advanced technology   :   https://www.mql5.com/en/users/incepline/seller The algorithm is based on ATR and Stochastic Oscillator indicators. You can modify these two parameters as you wish to adapt the settings to t
TPA True Price Action indicator reveals the true price action of the market makers through 100% non-repainting signals strictly at the close of a candle! TPA shows entries and re-entries, every time the bulls are definitely stronger than the bears and vice versa. Not to confuse with red/green candles. The shift of power gets confirmed at the earliest stage and is ONE exit strategy of several. There are available now two free parts of the TPA User Guide for our customers. The first "The Basics"
ブレーカートレーダーになり、価格が反転すると市場構造からの利益が変化します。 注文ブロックブレーカーインジケーターは、トレンドまたは価格の動きが枯渇に近づいており、逆転の準備ができていることを識別します。通常、反転または大規模なプルバックが発生しようとしているときに発生する市場構造の変化について警告します。 この指標は、ブレイクアウトと価格の勢いを識別する独自の計算を使用します。使い果たされる可能性のあるポイントの近くで新しい高値が形成されるたびに、インディケーターはその高値の作成を担当する最後の注文ブロックを描きます。次に、移動する価格とともに注文ブロックを追跡します。その後、価格が反対方向にシフトし、その注文ブロックを突破すると、新しい市場構造を作成し、トレンドまたは大きな後退の可能性のある反転の開始を警告します。 注文ブロックは、高値/安値が作成される前の最後の反対色のろうそくであり、価格がこれらの重要な領域を下抜けすると、トレンドの短期的ま​​たは長期的な反転の兆候です。 特徴 重要な枯渇点での市場構造の変化を警告します 価格が使い果たされるレベルに近づくと、
Bill Williams Advanced is designed for automatic chart analysis using Bill Williams' "Profitunity" system. The indicator analyzes four timeframes at once. Manual (Be sure to read before purchasing) Advantages 1. Automatically analyzes the chart using the "Profitunity" system of Bill Williams. The found signals are placed in a table in the corner of the screen. 2. Equipped with a trend filter based on the Alligator indicator. Most of the system signals are recommended to be used only accordi
初心者やエキスパートトレーダーに最適なソリューション! このインジケーターは、独自の機能と新しい計算式を取り入れた、ユニークで高品質、かつ手頃な価格のトレーディングツールです。たった1枚のチャートで28の為替ペアの通貨強度を読み取ることができます。新しいトレンドやスキャルピングチャンスの引き金となるポイントを正確に特定することができるので、あなたのトレードがどのように改善されるか想像してみてください。 ユーザーマニュアルはこちら  https://www.mql5.com/en/blogs/post/697384 これが最初の1本、オリジナルだ! 価値のないクローンを買わないでください。 特別な サブウィンドウの矢印で強い通貨の勢いを表示 GAPがあなたのトレードを導く! 基準通貨や気配値が売られすぎ・買われすぎのゾーン(外相フィボナッチレベル)にあるとき、個別チャートのメインウィンドウに警告表示。 通貨がレンジの外側から反落した場合、プルバック/リバーサルのアラート。 クロスパターンの特別なアラート 複数の時間枠を選択可能で、トレンドを素早く確認できます。通貨強
The indicator very accurately determines the levels of the possible end of the trend and profit fixing. The method of determining levels is based on the ideas of W.D.Gann, using an algorithm developed by his follower Kirill Borovsky. Extremely high reliability of reaching levels (according to K. Borovsky  - 80-90%) Indispensable for any trading strategy – every trader needs to determine the exit point from the market! Precisely determines targets on any timeframes and any instruments (forex, met
IVISTscalp5
Vadym Zhukovskyi
5 (5)
iVISTscalp5インジケーターをご紹介します。このインジケーターは、トレーディングにおいて独自でありながら効果的です。時間データに基づくこのインジケーターは、多年にわたる経験と金融市場の深い分析の結果です。iVISTscalp5インジケーターは、手動トレーディングにとって優れたツールです。便利さ、簡単さ、可視化 - すべての複雑さが内部に隠されています。私たちは、iVISTscalp5インジケーターの設定と使用を最大限に簡素化しました。このインジケーターは、MT5ターミナルにあるすべての金融商品に適しています。 稼働時間は、4時から20時(UTC+3)です。 iVISTscalp5インジケーターメニュー(スクリーンショット1を参照): History - 引用を計算する週数 dT_min - 時間間隔の選択(分) TFline - 水平ボリュームの作成(時間枠) BARSline - 水平ボリュームの作成(バー数) TFtrend1 - デイリーチャンネルの作成(時間枠) BARStrend1 - デイリーチャンネルの作成(バー数) TFtrend2 - 週次チャンネルの作成(時
** All Symbols x All Timeframes scan just by pressing scanner button ** ***Contact me after purchase to send you instructions and add you in "123 scanner group" for sharing or seeing experiences with other users. After 17 years of experience in the markets and programming, Winner indicator is ready. I would like to share with you! Introduction The 123 Pattern Scanner indicator with a special enhanced algorithm is a very repetitive common pattern finder with a high success rate . Interestingly,
IX Powerは 、FX Powerの無敵の精度をついにFX以外のシンボルにも提供します。 お気に入りの指数、株式、コモディティ、ETF、さらには暗号通貨の短期、中期、長期のトレンドの強さを正確に判断します。 お使いの端末が提供する すべてを分析する ことができます。ぜひお試しいただき、取引 タイミングが大幅に改善 されることをご体験ください。 IXパワーの主な特徴 100%正確で再描画されない計算結果 - ターミナルで利用可能なすべての取引シンボルに対して 予め設定され、さらに個別に設定可能な強度分析期間のドロップダウン選択 Eメール、メッセージ、モバイル通知による無数の通知オプション EAリクエストのためのアクセス可能なバッファ カスタマイズ可能な計算制限により、さらに優れたパフォーマンスを実現 もっと見たい人のための特別なマルチインスタンス設定 すべてのチャートでお好みの色を無限に設定可能 Windows 11とmacOSのスタイルで角を丸くした新しいパネルデザイン サブ・ウィンドウとメイン・チャートの間をシームレスに移動する、魔法のように動くイン
MT4版  |  FAQ Owl Smart Levels Indicator は、 Bill Williams の高度なフラクタル、市場の正しい波構造を構築する Valable ZigZag、エントリの正確なレベルをマークする Fibonacci レベルなどの一般的な市場分析ツールを含む 1 つのインジケーター内の完全な取引システムです。 利益を得るために市場と場所に。 戦略の詳細な説明 インジケータを操作するための指示 顧問-取引助手 プライベートユーザーチャット ->購入後に私に書いて、私はプライベートチャットにあなたを追加し、あなたはそこにすべてのボーナスをダウンロードすることができます 力はシンプルさにあります! Owl Smart Levels 取引システムは非常に使いやすいので、専門家にも、市場を勉強し始めて自分で取引戦略を選択し始めたばかりの人にも適しています。 戦略と指標に秘密の数式や計算方法が隠されているわけではなく、すべての戦略指標は公開されています。 Owl Smart Levels を使用すると、取引を開始するためのシグナルをすばやく確認し、注文を出すため
**   All Symbols   x   All Timeframes   scan just by pressing scanner button ** *** Contact me after the purchase to send you instructions and add you in "Trend Reversal group" for sharing or seeing experiences with other users. Introduction: Trendlines are the most famous technical analysis in trading . Trendlines continually form on the charts of markets across all the different timeframes providing huge opportunities for traders to jump in and profit on the action. In the other hand,  The tre
Introducing the South African Sniper indicator created by a small group of traders with a few years trading trading the financial market profitably . This is a plug and play indicator that provides you with  BUY and SELL (SNIPER ENTRY) signals with TARGET and trail stops. The indicator Works with all MT5 trading instruments. The indicator uses previous  chart data as receipt to speculate on future market moves.  "The South African Sniper indicator community are very happy with the indicator an
2つのオシレーターを組み合わせたもの。 1 つ目はエントリーポイントを表示し、2 つ目は現在のトレンドを表示します。このインジケーターは、すべての高速オシレーター信号または現在のトレンドの方向のみの信号の 2 つのモードで、オシレーター信号を矢印で表示できます。マルチタイムフレームパネルと 3 種類のシグナル通知があります。 利点: デイトレードやスキャルピング取引に適しています トレンドフィルタリング シンプルかつ高感度なセットアップ マルチタイムフレームパネル アドバイザーへの統合に適しています。 あらゆるシンボルとあらゆるタイムフレームに対応 3種類の通知 MT4版→   こちら / 問題解決→   こちら 指標戦略 このインジケーターは 2 つの異なるオシレーターで構成されます。 遅いトレンド ライン (太い) - インジケーターの高レベルが上から下に交差する場合、それは下降トレンドのインジケーターであり、下側の水平レベル (インジケーターの低レベル) が下から上に交差する場合、それは下降トレンドのインジケーターです。上昇傾向。さらに、下のゾーンで遅い線が見つかった場合は、現
作者のその他のプロダクト
ExtremeTMALine
Vasilii Luchnikov
4.8 (5)
少し速度のために変更されました。 テスターは、電子メールで私に書いて、興味を持っている新しい顧問のために必要とされます777basil@mail.ru インジケータは履歴の価格変化に基づいて計算され、数学的に計算され、データが再び受信されるたびに再計算されます。 それは異なる時間枠で使用することができます。 70%のインジケータの境界から、価格の動きや統合の方向に変化があります。 このようにして、トレンドとチャネルの中央の両方を国境から取引することができます。 抵抗/サポートレベルを決定するためにトレンド取引でそれを使用する方が良いです。 ビデオでは、インジケータの動作を確認できます:  https://youtu.be/UG2ZZEH9B_U 通信のための連絡先 777basil@mail.ru 私たちは、専門家、あなたのタスクのための指標を準備します。 インジケータは履歴の価格変化に基づいて計算され、数学的に計算され、データが再び受信されるたびに再計算されます。 それは異なる時間枠で使用することができます。 70%のインジケータの境界から、価格の動きや統合の方向に変化が
FREE
Ind2tompson
Vasilii Luchnikov
5 (1)
2indtompsonインジケータは、MT4端末用のアナログバージョンから作成されたペア取引または裁定取引のバランスをとるために、ボリュームを決定するための二つの あなたは二つの楽器が重量を量るだろうどのくらい比較する必要があり、あなたがそれを行う方法がわからないのであれば、チャート上のインジケータ さらに、インジケータは、互いに対する楽器の状態を示します-発散/収束。 M5/M15/H1時間枠で使用することをお勧めします 通信のための連絡先777basil@mail.ru あなたの技術的なタスクに従って、expert Advisor/indicator/scriptの書き込み、製造、リワーク、修正を行います。 ありがとう!. https://youtu.be/kgbIgnujuAM
FREE
今日は。. 我々は、トレーダーや市場アナリストのための新製品を準備しました。 私たちのvolumespreadtompson指標は、機関投資家が現在の価格に及ぼす影響を見るように設計されています。 インジケータは、その値が高いときの単位時間当たりのスプレッドの変化のレベルを示します。 練習は、ボリュームの変化が投機的活動の警告と前進に関連していることを示しています,   Practice shows that the change in volumes is associated with the warning and advance of speculative activity, especially at key moments: Fed news, oil news, speeches by leaders of the IDR countries.   We are very happy to present new developments.   Thanks. 
FREE
Mtrx2tompson
Vasilii Luchnikov
5 (1)
の指標に基づく指標を内蔵標準指標の指標を考慮し、電流指標の30の指標 そして、他の指標のすべての傾向の一般的な傾向を売買するための信号を与えます。 入力パラメータでは、各区分に特別なパラメータを設定できます。 インジケータはオシレータの形で実行され、すべてのインジケータの一般的な傾向と優位性を一方または他方の方向に示します。 https://youtu.be/UG2ZZEH9B_U の指標に基づく指標を内蔵標準指標の指標を考慮し、電流指標の30の指標 そして、他の指標のすべての傾向の一般的な傾向を売買するための信号を与えます。 入力パラメータでは、各区分に特別なパラメータを設定できます。 インジケータはオシレータの形で実行され、すべてのインジケータの一般的な傾向と優位性を一方または他方の方向に示します。
FREE
Привет. Сегодня представляем индикатор корреляции -  SynchroWindowTomson. Индикатор в одном окне показывает движение нескольких инструментов, по отношению друг к другу, удобно определять направление и изменение, особенно когда вы работаете с целым портфелем разных инструментов и нужно определить какой из них тянет результат назад и движется в другую сторону. Так же видны точки разворота спреда.
FREE
The DuettoFXTompson indicator is designed to work with two instruments that have a high level of correlation. the indicator can be used for pair trading on currencies, stocks, and other financial instruments. The indicator shows the moment when the instruments diverge and the sum of the two instruments (yellow line). additionally, the parameter of the Average MA value is calculated. Recommended timeframe for M5 operation. Contacts for communication 777basil@mail.ru we will prepare an expert, a
FREE
Добрый день. Сегодня добавили вспомогательный индикатор тренда DveMashkiTompson, идея взята из аналога МТ4 и перенесена на МТ5, используется совместно с индикаторами Тренда ТМА и МА, рисует красные и зеленые области в зависимости от направления рынка. Тренд вверх -зеленые области, тренд вниз -красные.Области основываются на пересечении индикатора МА, таким образом данный индикатор дает информацию графического содержания для более быстрой оценки ситуации и принятия решения.
FREE
PortfolioHedgingStopOrderOneSymbol-トレンド顧問,エリオットの第三波にチャネルの中央からの注文を開くために,レベルの内訳に取り組んでいます,チャネル幅TMAのカスタムインジ Expert Advisorは、あなたが強いトレンドの動きの確認を持っているが、あなたは初心者であり、まだあなたの行動の正しさを疑う場合、それは補正の終了を待我々はまた、我々は、補正の一般的な価格の動きを追跡する専門家を作成したと思う一般的な傾向の継続のためのエントリポイントを決定します。 TMAインジケータはチャンネル幅を決定し、チャンネル幅パラメータに対して、レベルがブレイクアウトポイントを決定するように設定され、チャンネル幅 損益分岐レベルが使用されています–ある程度の利益に達したときに開いているポジションのストップロスがトレーダーによって契約の開始価格に移 M5操作のための推薦された時間枠。通信のための連絡先777basil@mail.ru 私たちは、専門家、あなたのタスクのための指標を準備します。 ヴァシル-ヴァシリエフ 14時間前 良い一日Inyi,あなたのコ
こんにちは. CatchCandleLimitOrderOneSymbol-フラットexpert Advisorは、中央にチャネルの境界から注文を開くために、固定S/LとT/Pで、カスタムチャネル幅インジケータTMAから、サポートと抵抗レベルから最高の偏差を待ってから、受注buylimitで市場に参入するために常に良いです;selllimit,同様に私たちは、価格の全体的な動きを追跡することは、一般的な傾向から M5操作のための推薦された時間枠。 損益分岐レベルが使用されています–ある程度の利益に達したときに開いているポジションのストップロスがトレーダーによって契約の開始価格に移 損益分岐レベルが使用されています–ある程度の利益に達したときに開いているポジションのストップロスがトレーダーによって契約の開始価格に移 。通信のための連絡先777basil@mail.ru 私たちは、専門家、あなたのタスクのための指標を準備します。 https://youtu.be/WBoduCjpJCM
可能な反転ポイントの迅速な識別のために作られたインジケータVolumeTick,統合と双方向の取引トレーダーの条件,市場のボリュームの数が急激に増加,ツール市場の動 このようにして、取引を停止したり、他の方向に取引したり、確認された動きが私たちの方向に行われたときにボリュームを追加することを予見する これは、任意の時間枠に使用することができ、任意の実績のある取引システムのための良い追加になります。 https://youtu.be/tmHZKdMCMGo 通信のための連絡先777basil@mail.ru 私たちは、専門家、あなたのタスクのための指標を準備します。 https://youtu.be/UG2ZZEH9B_U Indicator VolumeTick made for rapid identification of possible reversal points, when the conditions of consolidation and bi-directional trading traders, the number of volumes in
https://youtu.be/Ze9zPpYtIrI GridCatchCandleLimitOrderOneSymbolは、チャネル境界から中央に注文を開くためのグリッドフラットexpert Advisorです。 それは固定S/LとT/Pで、カスタムTMAチャネル幅インジケータから、サポートと抵抗レベルからのプルバックで動作します。EAは、特定のトレンドの動きのレベルをトレードオフするように設計されており、間違いなくトレンドの継続であり、レベルはチャネル境界とより良い開口部の位置のための極端な価格ずれに基づいて価格で自動的にシフトされていますが、初心者であり、まだ彼らの行動の正しさに疑問があり、それは常に最高の偏差を待ってから注文BUYLIMITで市場に参入する方が良いと思います。SELLLIMIT、同様に私は考えています。我々は、価格の全体的な動きを追跡することは、一般的な傾向からのリターンのためのエントリポイントを定義する専門家を作成しました。 私達に索引、在庫、または用具の名前を言えば私達は私達のロボットのためのセットファイル(最適の設定)をのために送りますfree.
CatchPositionByStopOrder取引専門家は、取引の方向が知られているときにトレンド市場で動作するように設計されています,あなたはSELLSTOPとBUYSTOPの注文の両方を取引することができます,そして、あなたは方向を選択するために専門家自身を信頼することができます. セット中止の発注の動きやその背後に価格を決定する最も効果的な入力です。 取引のための推奨される時間枠はM5/M15/H1です。 Expert Advisorでは、固定されたS/lとT/pだけでなく、トロール網の助けを借りて作業することができます。 T/p=0の場合、s/l位置トロールは自動的に有効になり、まず損益分岐点ゾーンに移動し、有効距離で正の範囲で価格の後ろに移動して、トレンドの最大利益  私達に索引、在庫、または用具の名前を言えば私達は私達のロボットのためのセットファイル(最適の設定)をのために送りますfree.777basil@mail.ru    通信のための連絡先777basil@mail.ru 私たちはあなたの仕事のための指標である専門家を準備します。 Параметры
今日は。. 今日、私たちは新しい指標ポイントを提示しますTochanneltomson https://youtu.be/dmgtVwX3nvg https://youtu.be/Wr7N2WEY8lA -この指標は、チャネルから売買の方向、指標の緑と赤の窓の価格偏差のレベルまで計算されます。 偏差レベルが高いほど、反転の確率は大きくなります。 インジケータの読み取り値は新しいバーごとに再計算され、補助バーとしてのみ使用することをお勧めします 通信のための連絡先777basil@mail.ru 、私たちは専門家、あなたの仕事のための指標を準備します。 //入力パラメータ:    indPeriod         = 20;                   // Период усреднения для вычисления индикатор    indShift          = 0;                    // Отклонение от основной линии    indDeviation      = 2;   
今日は。. UturnAnalysis - インジケータの品質を確認するには 私たちは、MICEXの先物および株式市場のためのこの指標に基づいて逆転に関するシグナルの試用版の無料配布を開始しました 技術サポート、私に書き込みます777basil@mail.ru 、またはコメントであなたのメールアドレスと私たちはあなたにアラートが送信されるアカウントの詳細を送信します無料で。 https://youtu.be/q228LvLec-Y   私たちは一度にいくつかのツールに置きます https://youtu.be/Wr7N2WEY8lA あなたが有用な何かを行うことができます信号の間に、モニターであなたの時間を節約します, 反転ゾーンインジケータは、一定の時間におけるシンボル状態の複雑な分析器として設計されています。 今日、我々はあなたが事前に反転レベルを知っていれば、フラットとオーバークロック預金戦略に適しているベタバージョンを提示します, その後、行動を起こして利益を修正したり、損益分岐点にストップロスを移動したり、必要に応じて追加のボリュームを追加して取
フィルタ:
mosxdio
44
mosxdio 2021.04.14 15:56 
 

Useful!

Aleksandr Tamonin
4109
Aleksandr Tamonin 2021.01.12 18:20 
 

Очень полезный информационный индикатор! Спасибо автору!

レビューに返信