Painting Deals
- ユーティリティ
- Jinsong Zhang
- バージョン: 1.51
- アップデート済み: 20 11月 2021
- アクティベーション: 5
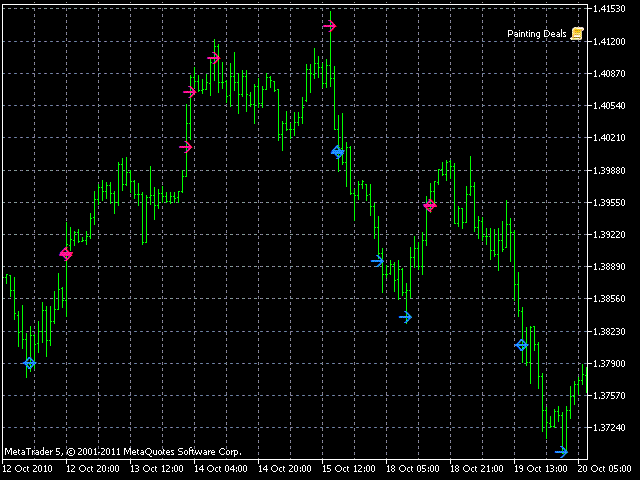
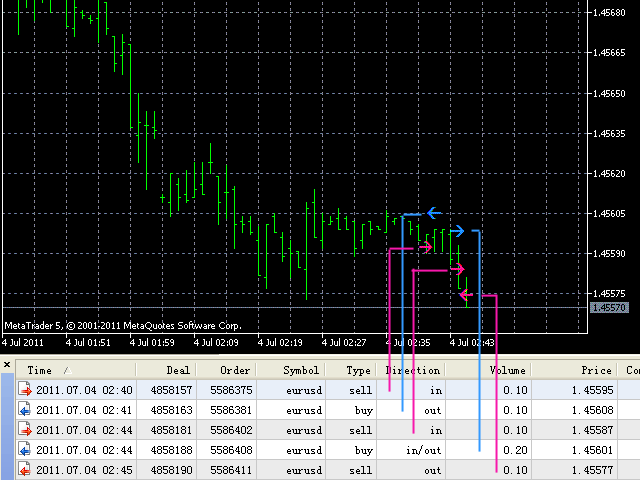
Painting Deals on active chart. It allows analyzing trade history on an account to which you have an investor (read only) password.
Type of the arrow displayed indicated the deal type:
- Right Arrow means In and In/Out deals
- Arrow Left Left means Out deals.
Blue arrows are for Buy deals and Red arrows are for Sell deals.
The indicator displays deals in the real time mode, it also displays their Stop Loss and Take Profit levels.
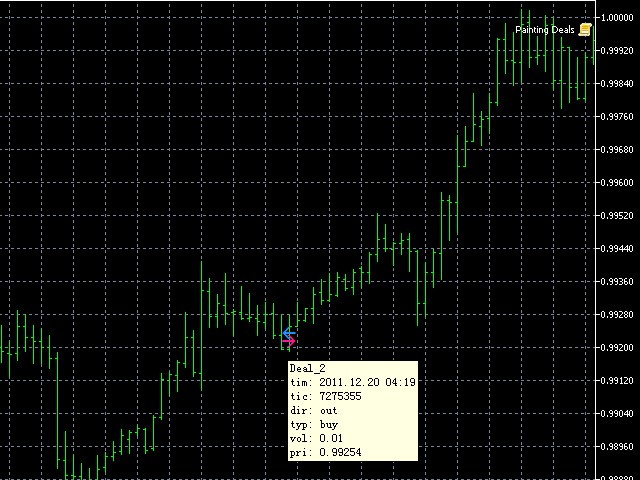
Put the mouse over the arrows to see the details of deals including open time, ticket, direction (in/out), type (buy/sell) and volume.
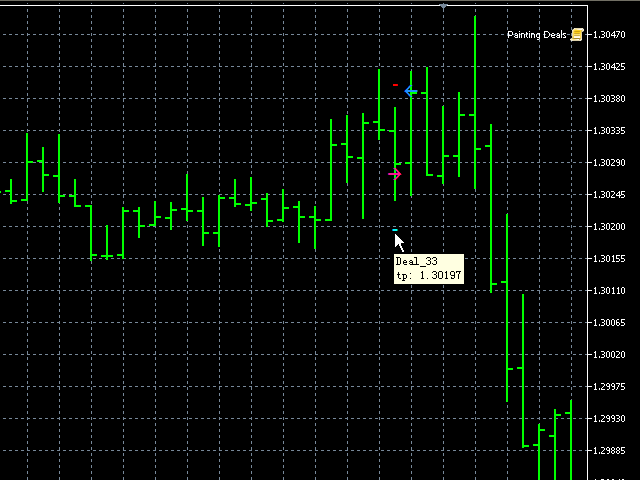
Put the mouse over the SL/TP line to see the exact value.


I just started today, so far this system has been excellent for me.