Currency Outlook
- インディケータ
- Kriengsak Peitaisong
- バージョン: 1.0
- アクティベーション: 20
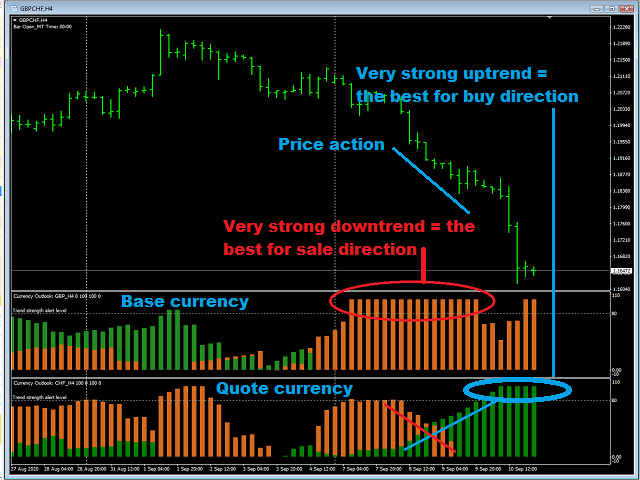
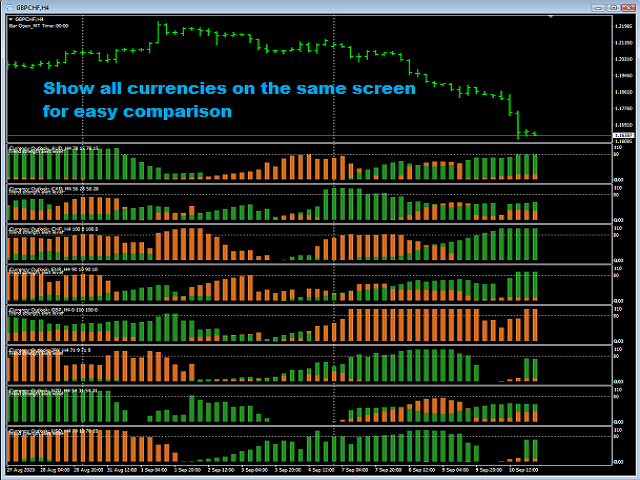
Currency Outlook is an indicator that can help us "Trade the right pair in the right direction and at the right time". This indicator analyzes prices of all cross currency pairs of the selected currency and report the result to us in form of double colours histogram diagram. The maximum height of the histogram diagram of the indicator is 100. The indicator is exclusively programming for AUD, CAD, CHF, EUR, GBP, JPY, NZD and USD. It can work in any timeframe in MT4. A feature for calculating trade lot size has been added to this indicator.
This indicator does not work in the strategy tester of MT4. Please follow the attached link to download the demo version for testing.
https://www.mql5.com/en/market/product/54649
Single histogram diagram interpretation:
Colour
- Green colour = a strength of uptrend direction.
- Chocolate colour = a strength of downtrend direction.
- Only one colour in the histogram = has a strength of the trend only in the direction of the painted colour.
- Two colours in the same histogram = a trend in a direction of the upper colour is stronger than a trend in a direction of the lower colour
Height
- Taller histogram = stronger trend.
- Shorter histogram = weaker trend.
- Histogram height =100(highest scale) = very strong trend.
- No histogram or very short histogram = price action is in a narrow range.
Very strong trend
- Series of histograms in same colour with a height at the highest level(100).
Strong trend
- Series of histograms in same colour(or another colour is very short) with a height below the highest level(100).
Pullback,
- Series of histograms in same colour and newer histogram is shorter than older histogram.
No significant trend/Gaining strength/Losing strength
- Series of histograms of 2 colours which one colour getting taller and another getting shorter.
Low volatile period
- Series of the short histograms.
Currencies pairing:
It is difficult to specify a solid rule of pairing to get the currency pair that will certainly give a profit from trading. However, pairing a currency that has the very strong trend/strong trend of the uptrend side with a currency of the very strong trend/strong trend of the downtrend side is reccommemded as a good choice.
Parameters:
- Main parameters
- Timeframe
- Select 'current' to bind the indicator timeframe to chart timeframe.
- Select '1 Minute' to '1 Month' to bind the indicator timeframe to the selected timeframe.
- Currency
- Select the named currency to bind the indicator currency to the selected currency.
- Select 'Base currency' or 'Quote currency' to bind the indicator currency to base currency or quote currency of the chart symbol.
- Start plot from shift
- input a number of the first bar index you want the indicator to plot i.e. 0=current bar, 1=the previous bar. This feature is prepared to use in backtest of trading strategy you may wish to do.
- Alert/Notification
- Histogram colour/thickness
- Trade calculator
Excellent seller and programmer, very simple but effective. Resource friendly and does what it says without fault, thank you