Noize Absorption Index - is the manual trading system that measures the difference of pressure between bears forces and bulls forces. Green line - is a noize free index that showing curent situation. Zero value of index shows totally choppy/flat market.Values above zero level shows how powerfull bullish wave is and values below zero measures bearish forces.Up arrow appears on bearish market when it's ready to reverse, dn arrow appears on weak bullish market, as a result of reverse expectation.
Fit line supports to extrapolation next movement of market, support for buy/sell decision. Indicator using spline algorithm to extrapolation. You can change number of spline with parameter "PointsNumber" and number of extrapolation point with "ExtrapolateBars". Eextrapolation points will be save into csv format, with prefix in parameter "PointsPrefix", and store in folder File of Data Folder.
Sniper2 , It has points of lines, with colors that are showing you an entrance, that work as support and resistance! green dotted lines green shows entry for sale, the red dotted lines show a buy entry, pay attention to the supports that work as a break to catch long candles in a longer period of time. works for forex all pairs works for synthetic indices all pairs ! indicator on sale!
This is an advanced multi-timeframe version of the popular Hull Moving Average (HMA) Features Two lines of the Hull indicator of different timeframes on the same chart. The HMA line of the higher timeframe defines the trend, and the HMA line of the current timeframe defines the short-term price movements. A graphical panel with HMA indicator data from all timeframes at the same time . If the HMA switched its direction on any timeframe, the panel displays a question or exclamation mark with a tex
Welcome to the Ultimate Harmonic Patterns recognition indicator that is focused to detect advanced patterns. The Gartley pattern, Bat pattern, and Cypher pattern are popular technical analysis tools used by traders to identify potential reversal points in the market.
Our Ultimate Harmonic Patterns recognition Indicator is a powerful tool that uses advanced algorithms to scan the markets and identify these patterns in real-time.
With our Ultimate Harmonic Patterns recognition Indicator, you
Indicator and Expert Adviser EA Available in the comments section of this product. Download with Indicator must have indicator installed for EA to work.
Mt5 indicator alerts for bollinger band and envelope extremes occurring at the same time. Buy signal alerts occur when A bullish candle has formed below both the lower bollinger band and the lower envelope Bar must open and close below both these indicators. Sell signal occur when A bear bar is formed above the upper bollinger band and upp
This indicator obeys the popular maxim that: "THE TREND IS YOUR FRIEND" It paints a Blue line for BUY and also paints a RED line for SELL. (you can change the colors). It gives alarms and alerts of all kinds. IT DOES NOT REPAINT COLOR and can be used for all currency pairs and timeframes. Yes, as easy and simple as that. Even a newbie can use it to make great and reliable trades. https://www.mql5.com/en/market/product/115553
Perfect Sniper! is a triple indicator with support resistance detection, downtrend channel, uptrend channel Bands included! where he hunts the rebounds in the red lines for sale, in the green lines mark purchase, in the lower bands that are the breaks gives another second entry either buy or sell, perfect to take advantage of the double entrance, It is used in any temporality, It is used to scalp and long on h1 or h4 to D1. It works for Forex markets, All pairs. It is used for the synthetic inde
Cumulative delta indicator As most traders believe, the price moves under the pressure of market buying or selling. When someone redeems an offer standing in the cup, the deal is a "buy". If someone pours into the bid standing in the cup - the deal goes with the direction of "sale". The delta is the difference between purchases and sales. A cumulative delta - the difference between the cumulative sum of purchases and sales for a certain period of time. It allows you to see who is currently contr
取引セッションインジケータは、各取引セッションの開始と終了を強調表示します 。
セッションの開始/終了をカスタマイズする可能性のある Trading_Session_Indicator_Free 製品の有料版。
[オプション:] Asian session Open Asian session Close Asian session OpenSummertime Asian session CloseSummertime European session Open European session Close European session Open European session Close Timeshift
最良の結果を得るには、M15-H2時間枠を使用してください。
時間枠M1、M5の修正を追加しました。 おおよその補正:
Bars Correction ------------------ 23.50 ____ 10 23.54 ____ 5 23.55 ____ 4(5) 00.05 ____ 5(6)
市場の私の他のプロダ
Volality Index scalper indicator Meant for Volality pairs such as Volality 10, 25, 50, 75 and 100 The indicator works on all timeframes from the 1 minute to the monthly timeframe the indicator is non repaint the indicator has 3 entry settings 1 color change on zero cross 2 color change on slope change 3 color change on signal line cross Orange line is your sell signal Blue line is your buy signal.
Laguerre SuperTrend Clouds adds an Adaptive Laguerre averaging algorithm and alerts to the widely popular SuperTrend indicator. As the name suggests, Laguerre SuperTrend Clouds (LSC) is a trending indicator which works best in trendy (not choppy) markets. The SuperTrend is an extremely popular indicator for intraday and daily trading, and can be used on any timeframe. Incorporating Laguerre's equation to this can facilitate more robust trend detection and smoother filters. The LSC uses the
Ichimoku Aiko MTF is a collection of technical indicators that show support and resistance levels, as well as momentum and trend direction. It is a multi-timeframe indicator so you don't need to change the chart timeframe when you want to see the ichimoku clouds on a higher timeframe. eg. The chart timeframe is M15 and you want to see on the M15 timeframe chart the H1 ichimoku indicators (the ichimoku in Metatrader can't do that) that's why you need to use Ichimoku Aiko MTF.
Think of an indicator that instantly shows you all supports, resistances and turncoats and can send a notification to your phone or an alarm on your computer. In addition to all these, it groups how many times it has entered each field and, accordingly, the strength of the field. Supply Demand And Turncoat is at your service. Setup for any TimeFrame and Chart you want and enjoy easy trading. Features: Ability to select the fields to be shown (weak, untested, turncoat, verified, proven) Merge fie
GIVE A LOOK TO MY OTHER PRODUCTS !
100 % PER MONTH PROFIT---- MY NEW SIGNAL HERE -------> https://www.mql5.com/en/signals/2162238?source=Site+Signals+My# BROKEN TRENDLINE ALERT IS A SIMPLE TOOL INDICATOR. JUST DRAW IN YOUR CHART A DYNAMIC OR STATIC TRENDLINE,AND THE INDICATOR WILL SEND YOU ALERT WHENEVER THE PRICE CROSSES BELOW OR ABOVE YOUR DRAWN TRENDLINE. IT WORKS IN ANY TIMEFRAME AND ANY CHART YOU WANT.JUST GOT A VPS AND DON'T STRESS IN FRONT OF YOUR COMPUTER.
FOR ANY KIND OF QUESTION
Mine Farm is one of the most classic and time-tested scalping strategies based on the breakdown of strong price levels.
Mine Farm is the author's modification of the system for determining entry and exit points into the market...
Mine Farm - is the combination of great potential with reliability and safety.
Why Mine Farm?!
- each order has a short dynamic Stop Loss
- the advisor does not use any risky methods (averaging, martingale, grid, locking, etc.)
- the advisor tries to get
An indicator of pattern #31 ("Long Island") from Encyclopedia of Chart Patterns by Thomas N. Bulkowski. The second gap is in the opposite direction.
Parameters: Alerts - show alert when an arrow appears Push - send a push notification when an arrow appears (requires configuration in the terminal) GapSize - minimum gap size in points ArrowType - a symbol from 1 to 17 ArrowVShift - vertical shift of arrows in points ShowLevels - show levels ColUp - color of an upward line ColDn - color of a
KT Renko Patterns scans the Renko chart brick by brick to find some famous chart patterns that are frequently used by traders across the various financial markets. Compared to the time-based charts, patterns based trading is easier and more evident on Renko charts due to their uncluttered appearance.
KT Renko Patterns features multiple Renko patterns, and many of these patterns are extensively explained in the book titled Profitable Trading with Renko Charts by Prashant Shah. A 100% automate
The trend is your friend!
Look at the color of the indicator and trade on that direction. It does not repaint. After each candle is closed, that's the color of the trend. You can focus on shorter faster trends or major trends, just test what's most suitable for the symbol and timeframe you trade. Simply change the "Length" parameter and the indicator will automatically adapt. You can also change the color, thickness and style of the lines. Download and give it a try! There are big movements
Was: $249 Now: $99 Market Profile defines a number of day types that can help the trader to determine market behaviour. A key feature is the Value Area, representing the range of price action where 70% of trading took place. Understanding the Value Area can give traders valuable insight into market direction and establish the higher odds trade. It is an excellent addition to any system you may be using. Inspired by Jim Dalton’s book “Mind Over Markets”, this indicator is designed to suit the
US30 Ninja is a 5 minute scalping indicator that will let know you when there is a trade set up (buy or sell). Once the indicator gives the trade direction, you can open a trade and use a 30 pip stop loss and a 30 pip to 50 pip take profit. Please trade at own own risk. This indicator has been created solely for the US30 market and may not yield positive results on any other pair.
ini adalah indikator khusus digunakan untuk trading di binary.com dengan pair volatility 75. indikator ini sangat simpel dan mudah digunakan baik untuk yang sudah profesional atau pun yang baru dalam dunia trading terutama yang baru di market volatility 75.indikator ini lebih bertujuan untuk scalping trader dan menggunakan timeframe M1 sebagai acuan untuk entry. adapun jika ingin mempelajari lebih lanjut bisa menghubungi di telegram https://t.me/shadowbreakerfx . untuk SOP lengkap silahkan klik
Description : Rainbow EA MT5 is a simple Expert advisor based on Rainbow MT5 indicator witch is based on Moving average with period 34. The indicator is incorporated in the EA, therefore, it is not required for the EA to operate, but if you wish, you can download it from my product page . The Expert Advisor settings are as follows : Suitable for Timeframes up to H1
The parameters below can be set according to your trading rules. StopLoss ( Stop Loss in pips) TakeProfit ( Take Profit in pi
The well-known ZigZag indicator that draws rays based on the "significant movement" specified by the pips parameter. If a ray appears, it will not disappear (the indicator is not redrawn), only its extremum will be updated until the opposite ray appears. You also can display text labels on each rays describing the width of the ray in bars and the length of the ray in points.
Black Card Pack indicator 5/3 Green power It has the high and low breakout strategy giving the signal with the red or green dot the red dot for short and the green dot for long , perfect for forex markets and synthetic index markets, works for all seasons It is used for scalping and intraday! Ideal for Crash and boom markets!! Volatilitys y jumps !! Micro y macro en forex !
Reversal First Impulse levels (RFI) INSTRUCTIONS RUS - ENG R ecommended to use with an indicator - TREND PRO - Version MT4 A key element in trading is zones or levels from which decisions to buy or sell a trading instrument are made. Despite attempts by major players to conceal their presence in the market, they inevitably leave traces. Our task was to learn how to identify these traces and interpret them correctly.
Main functions:: Di
TPSpro TRENDPRO - is a trend indicator that automatically analyzes the market and provides information about the trend and each of its changes, as well as giving signals for entering trades without redrawing! The indicator uses each candle, analyzing them separately. referring to different impulses - up or down impulse. Exact entry points into transactions for currencies, crypto, metals, stocks, indices! - Version MT4 DETAILED DESCRIPTION R ecommended to use with
Bill Williams Advanced is designed for automatic chart analysis using Bill Williams' "Profitunity" system. The indicator analyzes four timeframes at once.
Manual (Be sure to read before purchasing)
Advantages
1. Automatically analyzes the chart using the "Profitunity" system of Bill Williams. The found signals are placed in a table in the corner of the screen.
2. Equipped with a trend filter based on the Alligator indicator. Most of the system signals are recommended to be used only accordi
74% discount for the next 10 buyers (original price $605): 1 left
Get a 50% bonus by buying (or even renting) any of our products. After buying (or renting), send a message for more information. 3 Indicators in 1 indicator
Strategy based on price action
Made specifically for the best forex currency pairs
Can be used in the best time frame of the market
at a very reasonable price This indicator is basically 3 different indicatos . But we have combined these 3 indicators in 1 indicator so th
Auto Order Block with break of structure based on ICT and Smart Money Concepts (SMC)
Futures Break of Structure ( BoS )
Order block ( OB )
Higher time frame Order block / Point of Interest ( POI ) shown on current chart
Fair value Gap ( FVG ) / Imbalance - MTF ( Multi Time Frame )
HH/LL/HL/LH - MTF ( Multi Time Frame )
Choch MTF ( Multi Time Frame )
Volume Imbalance , MTF vIMB
Gap’s Equal High / Low’s ,
"Piranha" - an autonomous trading system that determines overbought and oversold levels on the chart. Red and blue zones represent overbought and oversold levels respectively. Entry points are marked with arrows: a downward arrow in the red zone for "sell" and an upward arrow in the blue zone for "buy". The Take profit level is indicated by the green moving average. Key features: Adjusting the Take profit level as the green moving average changes position. Averaging ability when a new market e
Step into the realm of Forex trading with confidence and precision using XQ, a cutting-edge Forex indicator designed to elevate your trading game to unprecedented heights. Whether you're a seasoned trader or just stepping into the world of currency exchange, XQ Forex Indicator empowers you with the insights and signals needed to make informed trading decisions. The signal conditions are a combination of three indicators, and XQ Forex Indicator only display medium and long-term trends . The ind
Introducing the South African Sniper indicator created by a small group of traders with a few years trading trading the financial market profitably . This is a plug and play indicator that provides you with BUY and SELL (SNIPER ENTRY) signals with TARGET and trail stops. The indicator Works with all MT5 trading instruments. The indicator uses previous chart data as receipt to speculate on future market moves.
"The South African Sniper indicator community are very happy with the indicator an
TPA True Price Action indicator reveals the true price action of the market makers through 100% non-repainting signals strictly at the close of a candle!
TPA shows entries and re-entries, every time the bulls are definitely stronger than the bears and vice versa. Not to confuse with red/green candles. The shift of power gets confirmed at the earliest stage and is ONE exit strategy of several. There are available now two free parts of the TPA User Guide for our customers. The first "The Basics"
The Price Action Finder Multi indicator is an indicator of entry points that searches for and displays Price Action system patterns on dozens of trading instruments and on all standard time frames: (m1, m5, m15, m30, H1, H4, D1, Wk, Mn). The indicator places the found patterns in a table at the bottom of the screen. By clicking on the pattern names in the table, you can move to the chart where this pattern is located. Manual (Be sure to read before purchasing) | Version for MT4 Advantages
1. Pa
Fractal Advanced - displays Fractal and Alligator indicators on the price chart. Has wide options for settings and customization. It is also equipped with alerts and a hotkey system. Manual (Be sure to read before purchasing) | Version for MT4 Advantages
1. The indicator does not fill the entire chart with fractals, but allows you to display only relevant signals. 2. The number of fractals is adjusted by scrolling the mouse while holding down the Shift key. 3. Instantly show/hide the Alligator
Gartley Hunter Multi - An indicator for searching for harmonic patterns simultaneously on dozens of trading instruments and on all possible timeframes. Manual (Be sure to read before purchasing) | Version for MT4 Advantages 1. Patterns: Gartley, Butterfly, Shark, Crab. Bat, Alternate Bat, Deep Crab, Cypher
2. Simultaneous search for patterns on dozens of trading instruments and on all possible timeframes
3. Search for patterns of all possible sizes. From the smallest to the largest
4. A
Golden Spikes Detector This indicator is based on an advanced strategy primarily for trading spikes on Boom and Crash Indices. Complex algorithms were implemented to detect high probability entries only. It alerts on potential Buy and Sell entries. To trade spikes on the Deriv or Binary broker, only take Buy Boom and Sell Cash alerts. It was optimised to be loaded on 5-minute timeframe although multiple timeframe analysis is done in the background. Features · Desktop pop up and sound
This is the MT5 version. Get Dual Onset MT4 here
It is an algorithm to detect trend changes early. You should try multiple values for the Multiplier parameter (1 <value <10 recommended). At first glance you can see effective entries. This is, in fact, one of the rows that Geleg Faktor initially had. But it was removed because it was no longer needed. The other rows were sufficient for G.Faktor's effectiveness, but I still wanted to share this one.
Always test before using it on your live
This is the MT5 version. Get Q-Math MT4 here
Check it out and if you like it just enjoy it. Try various values to find the setting that best suits your trading. Upward signal if the indicator is colored lawn green and bearish signal if the indicator is gray. You can use the line itself to trailing stop when you open orders. This is just a tool. A complement. It is not a strategy. Combine it with your own analysis Just download it and try it, it's free.
Here are several indicators that work together. It basically works with moving averages and various levels of ATR creating a dynamic channel through which the price is drained. As I always recommend, you should try it before using it in live so that you understand how it works. The market entry signal is similar to other MA indicators, but with this one you also have a graphical analysis of the moment when the trend is found and dynamic levels to adjust your stop loss and take profit depending
This is MT5 version Get Tunnel Warrens MT4 here
Here are several indicators that work together. It basically works with moving averages and various levels of ATR creating a dynamic channel through which the price is drained. As I always recommend, you should try it before using it in live so that you understand how it works. The market entry signal is similar to other MA indicators, but with this one you also have a graphical analysis of the moment when the trend is found and dynamic levels to
With this customizable indicator you will be able to observe other timeframes besides the usual one. This way you will get to know better the general environment in which the price moves and probably will be better your effectiveness. *It is important that the timeframe in the indicator is greater than that set in Metatrader. I'll share more indicators for free soon. If you have any specific ideas of an indicator that you want to have you can write me a private message directly. Opinions, review
It is an algorithm to detect trend changes early. You should try multiple values for the Multiplier parameter (1 <value <10 recommended). At first glance you can see effective entries. This is, in fact, one of the rows that Geleg Faktor initially had. But it was removed because it was no longer needed. The other rows were sufficient for G.Faktor's effectiveness, but I still wanted to share this one.
Always test before using it on your live account so that you fully understand how it works and
Based on a combination of indicators, PS Acid Fulx is an excellent indicator for knowing when to buy or sell on any asset and temporaryity. The indicator myself I have used it as a tool for my analysis when trading Forex. It is a useful and easy-to-understand trend indicator. If you combine it with your own analyses you will surely get a good result in your operation.
Check it out and if you like it just enjoy it. Try various values to find the setting that best suits your trading. Upward signal if the indicator is colored lawn green and bearish signal if the indicator is gray. You can use the line itself to trailing stop when you open orders. This is just a tool. A complement. It is not a strategy. Combine it with your own analysis Just download it and try it, it's free.
Based on a combination of indicators, E13 Acid Fulx is an excellent indicator for knowing when to buy or sell on any asset and temporaryity. The indicator myself I have used it as a tool for my analysis when trading Forex. It is a useful and easy-to-understand trend indicator. If you combine it with your own analyses you will surely get a good result in your operation.
Buy and sell signals using the MACD histogram. The interface is simple and easy to understand. You can perzonalize the indicator in several ways according to its visual style or even more importantly, its setting of parameters to detect market signals. Using the Multiplier option in the menu you can increase the indicator period although it is recommended to use the default settings.
Trading is about waiting for the right time. This indicator was created to know what is happening on our charts without having to cover the screen with indicators. In addition, it has several types of alerts that allow us to dedicate our time to other things until something interesting happens. You can use multiple alarms at the same time. It is not a problem.
By default AlterAlert offers us alerts when the following indicators give us a signal:
Moving average (MA crosses) Stochastic Oscill
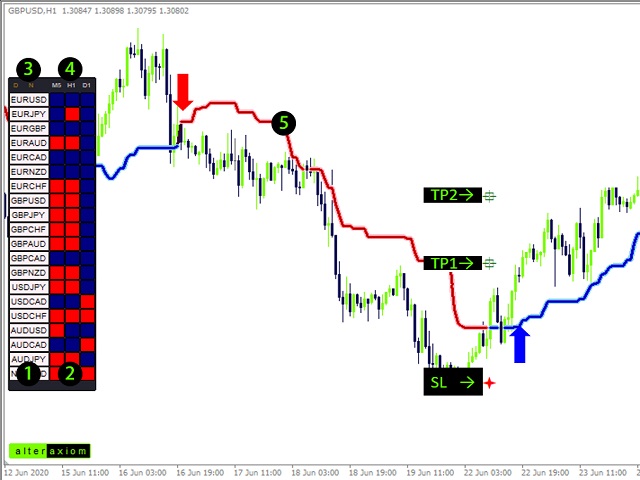
In the third screenshot (Daylight Mode) I have marked 7 elements that we are going to explain step by step.
1 Three buttons.
a) Night Mode
b) Daylight Mode
c) Fixed scale / Adjusted scale
2 Four buttons.
a) Draw a buy arrow, buy line and the corresponding Stop Loss based on ATR.
b) Close the previously drawn buy and drows a check mark.
c) Draw a sell arrow, sell line and the corresponding Stop Loss based on ATR.
d) Close the previously drawn sell and d
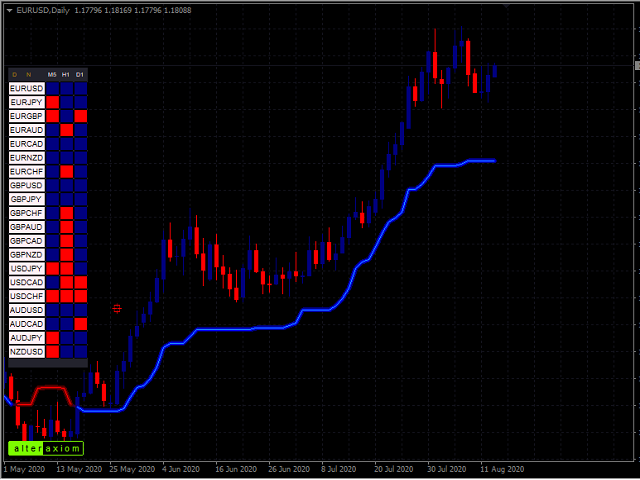
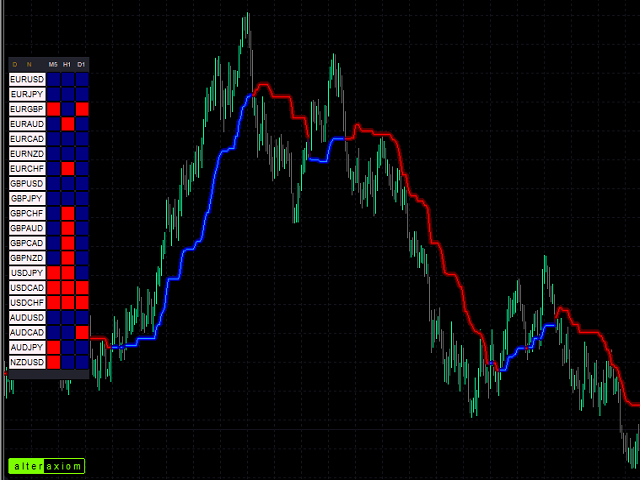
The new indicator is a trend predictor for the current chart as well as other symbols and timeframes. Every button on the board is interactive. By default, you have 20 currency pairs in the watchlist and three timeframes (M5, H1, D1) but you can choose the periods and symbols you want to display from the menu.
If the indicator is blue, it indicates the beginning of an uptrend. If it is red, it indicates the beginning of a downtrend.
In capture # 3 (Daylight mode) I will explain each element
Trading is about waiting for the right time. This indicator was created to know what is happening on our charts without having to cover the screen with indicators. In addition, it has several types of alerts that allow us to dedicate our time to other things until something interesting happens. You can use multiple alarms at the same time. It is not a problem. By default AlterAlert offers us alerts when the following indicators give us a signal:
Moving average (MA crosses) Stochastic Oscillat
It is a truly useful multifunctional tool. I did it thinking about my needs as a trader some years ago although I have been modifying it for my partners to use it.
This tool allows: Directly send buy or sell orders with one click and shows where you should place the stop loss based on an algorithm using ATR and comparison with previous significant levels.
Close all profits by clicking a button.
Close all losses by clicking a button.
Close all operations by clicking a button.
Show
This is the MT5 version. Get MT4 version here → https://www.mql5.com/en/market/product/52923
In the third screenshot (Daylight Mode) I have marked 7 elements that we are going to explain step by step.
1 Three buttons. a) Night Mode b) Daylight Mode c) Fix scale / Adjusted scale
2 Four buttons.
a) Draw a buy arrow, buy line and the corresponding Stop Loss based on ATR.
b) Close the previously drawn buy and drows a check mark.
c) Draw a sell arrow, sell line

ユーザーは評価に対して何もコメントを残しませんでした