FXC iRSI DivergencE MT4
- インディケータ
- Zsolt Haromszeki
- バージョン: 1.6
- アップデート済み: 16 1月 2023
- アクティベーション: 20
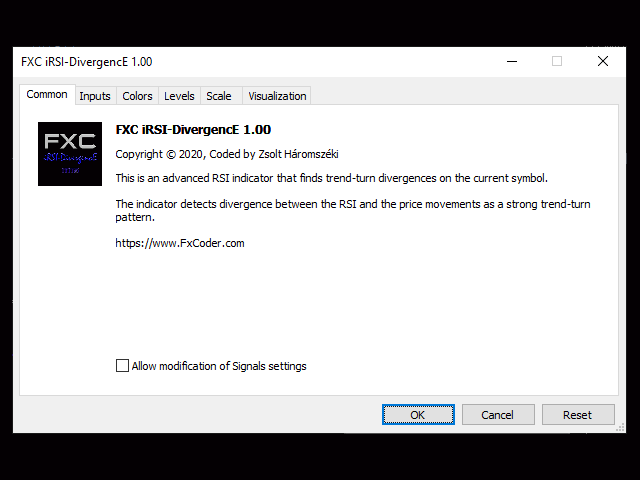
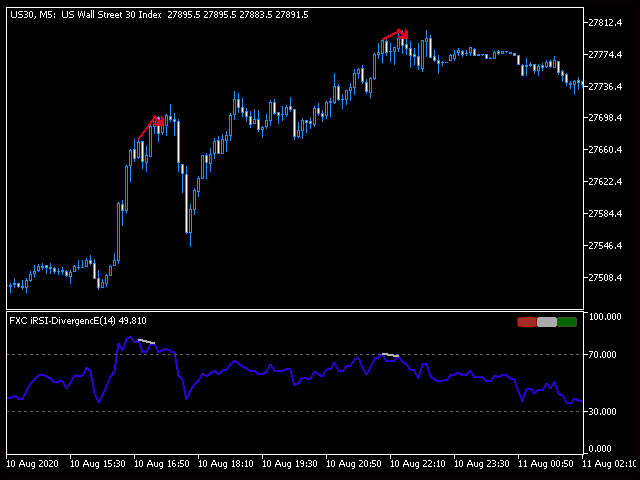
FXC iRSI-DivergencE MT4 Indicator
This is an advanced RSI indicator that finds trend-turn divergences on the current symbol. The indicator detects divergence between the RSI and the price movements as a strong trend-turn pattern.
Main features:
- Advanced divergence settings
- Price based on Close, Open or High/Low prices
- Give Buy/Sell open signals
- PUSH notifications
- E-mail sending
- Pop-up alert
- Customizeable Information panel
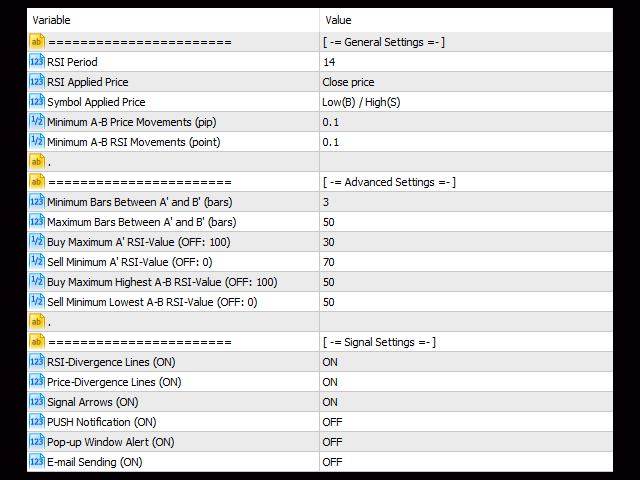
- RSI Period: The Period size of the RSI indicator.
- RSI Applied Price: Applied price for the RSI indicator. It can be: Close, Open, High, Low, Median, Typical, Weighted.
- Symbol Applied Price: Applied price of the current symbol. It can be: Close, Open, Low(B)/High(S).
- Minimum A-B Price Movements (pip): Determines the minimum price movements between the A' and B' points of the divergence.
- Minimum A-B RSI Movements (point): Determines the minimum RSI value movements between the A' and B' points of the divergence.
- Minimum Bars Between A' and B' (bars): The number of minimum bars allowed between the A' and B' points.
- Maximum Bars Between A' and B' (bars): The number of maximum bars allowed between the A' and B' points.
- Buy Maximum A' RSI-Value (OFF: 100): The maximum RSI value of the A' point of the Buy divergence.
- Sell Minimum A' RSI-Value (OFF: 0): The minimum RSI value of the A' point of the Sell divergence.
- Buy Maximum Highest A-B RSI-Value (OFF: 100): The highest RSI value allowed between A' and B' points for Buy divergence.
- Sell Minimum Lowest A-B RSI-Value (OFF: 0): The minimum lowest RSI value allowed between A' and B' points for Sell divergence.
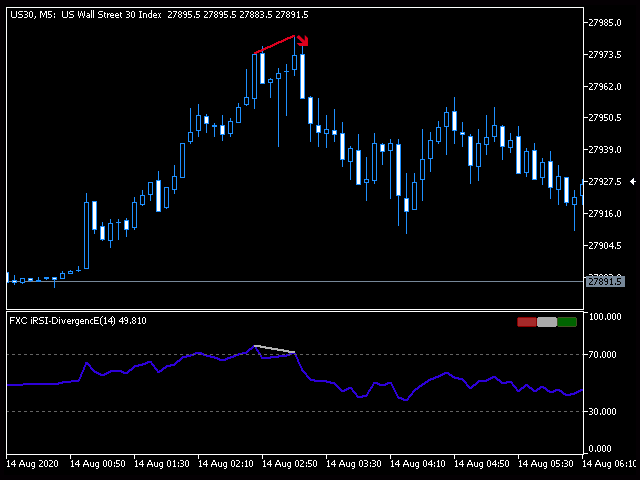
- RSI-Divergence Lines (ON): Draws divergence lines to the indicator window at signals.
- Price-Divergence Lines (ON): Draws divergence lines to the price chart at signals.
- Signal Arrow (ON): Draws arrows to the chart at signals.
- PUSH Notification (ON): Sends PUSH notifications at signals.
- Pop-up Window Alert (ON): Sends pop-up alerts at signals.
- E-mail Sending (ON): Sends e-mails at signals.
- Infopanel (ON): Switch Turns the information panel on or off.
- Infopanel Color-1: Color-1 of the information panel.
- Infopanel Color-2: Color-2 of the information panel.
- Infopanel Color-3: Color-3 of the information panel.
- Infopanel Background (ON): Turns the background of the information panel on or off.
- Infopanel Background Color: Sets the background color of the information panel.
- Divergence Price-Line Buy-Color: Divergence Price-Line color of the Buy signs.
- Divergence Price-Line Sell-Color: Divergence Price-Line color of the Sell signs.
- Divergence Price-Line Width: Width of the Price-Line.
- Divergence Price-Line Style: Style of the Price-Line.
- Divergence RSI-Line Buy-Color: Divergence RSI-Line color of the Buy signs.
- Divergence RSI-Line Sell-Color: Divergence RSI-Line color of the Sell signs.
- Divergence RSI-Line Width: Width of the RSI-Line.
- Divergence RSI-Line Style: Style of the RSI-Line.
- Arrow Color Buy: Arrows color for Buy signals.
- Arrow Color Sell: Arrows color for Sell signals.
- Arrow Size (pixel): Arrows size in pixel.
- Arrow Shift Buy (Low + X pip): With this parameter, you can shift the price of the Buy arrows relative to the Low price.
- Arrow Shift Sell (High + X pip): With this parameter, you can shift the price of the Sell arrows relative to the High price.
- Drawback (bars): Number of bars drawn divergence signs back in the past.
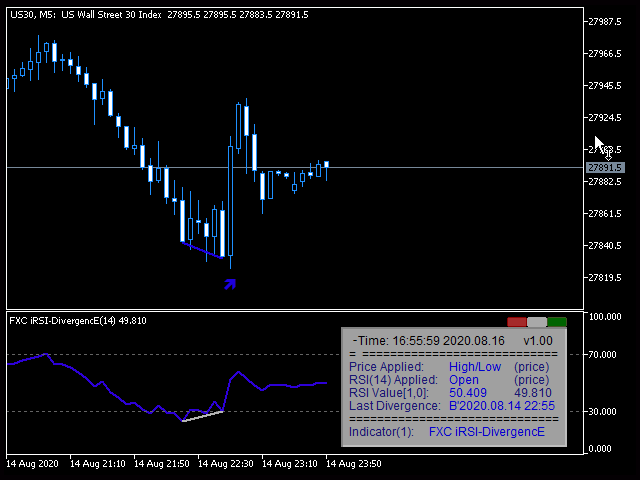
- Price Applied: Applied price of the current symbol.
- RSI(14) Applied: Applied price of the RSI incidator. In the parentheses, there is the Period size of the RSI.
- RSI Value[0,1]: RSI values of the last two bars.
- Last Divergence: Shows the time of the last divergence sign. The B' or S' represents the direction: Buy or Sell.
- Indicator(1): Shows the name of the indicator. The number in the parentheses represents the subwindow of the indicator.
Buttons:
- There are three little buttons at the right-upper corner of the information panel.
- RED button: It removes the indicator from the chart.
- WHITE button: Do nothing.
- GREEN button: It turns on or off the information panel.


This indicator seems to do a good job of finding RSI Divergence and displaying its lines on price and the RSI Divergence sub-panel. Ability to configure it is good. For me, currently, Pop-up Window Alert (ON) usually does not work. I get pop-up alerts on less than 10% of the divergences that I see on the charts. I have the indicator running on 30 charts with D1, H4, H1 and M30. Now, with this problem, I can only rate the indicator "2". If this problem was fixed I would rate it "5".
I tested the indicator. I did not experience the phenomenon. The indicator always sent me PopUp alerts. I suggest you to reinstall your MetaTrader.
I built-in an PopUp-Alert-Test funcition for you (v1.04). If you push the white little button at the left-upper corner of the InformationPanel, the indicator will send you an alert test-message. So, you can test your MT4 platform with it.
I hope, you will find the cause of the error. If you have any questions, feel free to contact me.