This indicator emulates volume delta (buy trades vs sell trades) based on per candle volume and candle shape (direction, size of body and wicks). Artificially separated buy and sell volumes then accumulated for specified number of bars. The indicator shows a histogram of volume delta per bar, as well as a sum of the delta for the given period. What is more important, the indicator allows you to combine current symbol quotes/volumes with quotes/volumes of other related symbols (futures, indices,
The Rayol Code Hour Interval Lines indicator was designed to assist your trading experience. It draws the range of hours chosen by the user directly on the chart, so that it enables traders to visualize price movements during their preferred trading hours, providing traders a more comprehensive view of price movements and market dynamics. This indicator allows the user to choose not only the Broker's time, but also the Local time. This way, the user no longer needs to calculate local time in
This Mt5 Indicator Signals when there is two opposite direction bars engulfed by current bar. has a recent Exponential Moving Average Cross and past bar was oversold/bought Expert Advisor Available in Comments Free Version Here : https://www.mql5.com/en/market/product/110114?source=Site  ; Full Alerts for mt5 terminal , phone , email, print to file, print to journal Buy Signal ( blue line ) Past ema cross ( set at 30 bars back ) Past bar rsi is oversold ( level 40 ) Engulfing bar closes
Double Correlation indicator (free) plots two windowed correlations in a separate window. the size of window is taken as input before the two symbols to correlate to. Two symbols are taken as an input parameters as well as period length. and the two correlations are computed with the currently shown symbol ex: input GBPJPY and AUDNZD. current symbol EURUSD then the following will be computed corr(EURUSD,GBPJPY) and corr(EURUSD,AUDNZD) The indicator can be useful to run a multi-symbol pair trad
This indicator show the candle remaining time on the chart and/or in the corner of the window. It also display notificaton (popup and push) when a new candle is formed (optional). You configure the timer on candles and at chart corner. I don't need to explain the functions because are very simple. MT4 version: https://www.mql5.com/en/market/product/38677 Any doubt or suggestion please contact us. Enjoy!
This is a free indicator, but it took hours to develop. If you want to pay me a coffee, I
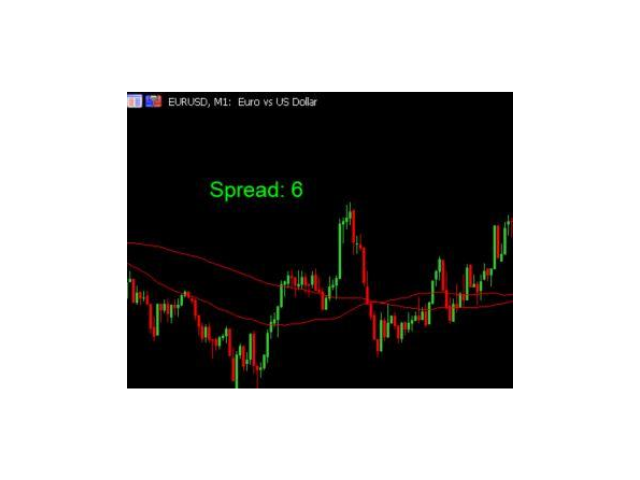
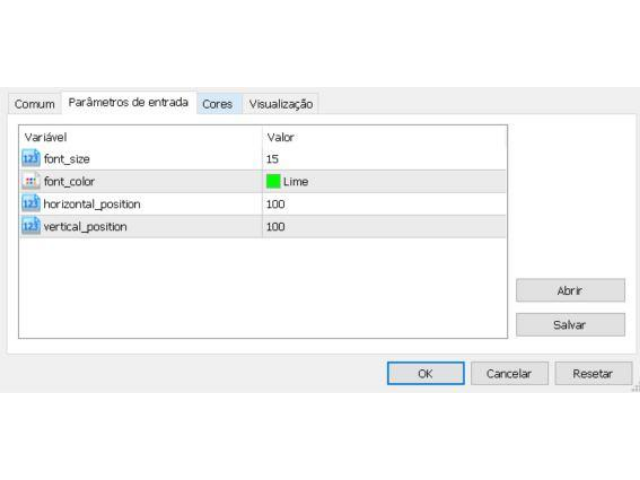
主要城市的时间。北京时间、东京时间、悉尼时间、惠灵顿时间、纽约时间、法兰克福时间、伦敦时间、迪拜时间。 城市时间可选择开启或者关闭。 点差变色提醒。设置点差提醒点数,例如,设置100点,点差大于100点,文字会变红色。 Time in major cities. Beijing time, Tokyo time, Sydney time, Wellington time, New York time, Frankfurt time, London time, Dubai time. City time can be turned on or off. Dot difference color change reminder. Set the point difference reminder points. For example, set 100 points. If the point difference is greater than 100 points, the text will turn red.
The idea of a Value Chart indicator was presented in the very good book I read back in 2020 , " Dynamic Trading Indicators: Winning with Value Charts and Price Action Profile ", from the authors Mark Helweg and David Stendahl. The idea is simple and the result is pure genius: Present candlestick Price analysis in a detrended way!
HOW TO READ THIS INDICATOR
Look for Overbought and Oversold levels. Of course, you will need to test the settings a lot to find the "correct" one for your approach.
TradeInfo is a utility indicator which displays the most important information of the current account and position.
Displayed information: Information about the current account (Balance, Equity, Free Margin). Current spread, current drawdown (DD), planned profit, expected losses, etc. Number of open position(s), volume (LOT), profit. Today’s and yesterday’s range. Remaining time to the next candle. Last day profit information. MagicNumber filter. Comment filter.
Indicator parameters: Show
A small utility displays the time in five time zones. You can customize the display of one to five time zones. For each time it is configured: show or not; name; time offset from GMT; color; In general settings, you can change: date / time format ("hh: mi", "hh: mi: ss", "yyyy.mm.dd hh: mi", "yyyy.mm.dd hh: mi: ss") font name; font size; offset from the left edge of the chart; offset from the top edge of the chart;
This indicator will mirror the assets in use in another metatrader, being able to choose the timeframe and a template. This is the Metatrader 5 Client, it needs the Metatrader 4 or 5 Server versions: Metatrader 4 Mirror Chart Server: https://www.mql5.com/en/market/product/88644
Metatrader 5 Mirror Chart Server: https://www.mql5.com/en/market/product/88652 Details of how it works in the video.
This information indicator will be useful for those who always want to be aware of the current situation on the account.
- More useful indicators
The indicator displays data such as profit in points, percentage and currency, as well as the spread for the current pair and the time until the bar closes on the current timeframe. There are several options for placing the information line on the chart: - To the right of the price (runs behind the price); - As a comment (in the upper left corner
Smart Grid MT5 automatically recognizes any symbol, period and scale of the chart and marks it up accordingly. It is possible to mark up the chart by trading sessions. The grid consists of the two main line types.
Vertical lines There are two visualization methods: Standard - the lines are divided into three types, separating: Small time period. Medium time period. Large time period. Trading Session - the lines are divided into groups (a total of ten). Each group has two lines: the first is re
The indicator My Big Bars can show bars (candles) of a higher timeframe. If you open an H1 (1 hour) chart, the indicator puts underneath a chart of H3, H4, H6 and so on. The following higher timeframes can be applied: M3, M5, M10, M15, M30, H1, H3, H4, H6, H8, H12, D1, W1 and MN. The indicator chooses only those higher timeframes which are multiple of the current timeframe. If you open an M2 chart (2 minutes), the higher timeframes exclude M3, M5 and M15. There are 2 handy buttons in the lower r
Micro Demo ******************* Секундные графики в Meta Trader 5 ********************** Более точного инструмента для входа в сделку вы не найдёте. Платная полная версия: Micro "Second charts" В демоверсии секундные периоды сменяются случайным образом через случайные интервалы времени. Отсутствует автоматическая настройка периодов бесплатных индикаторов.
Входные параметры: Displayed bars - отображаемые бары Step of price levels, pp, 0-off - шаг отрисовки ценовых уровней, пункты Scale
This little tool helps you to define your risk management with a simple line dragging on the chart. It shows you the actual lot size calculated on account % or fixed money amount directly at the line. All you have to do is activate the line by pressing the "t" key on your keyboard and drag the line to your stop loss point. Thats it. In the settings you can define the color and width of line and text, also space of text to line and the right and you can set the risk in percent of account or fixed
The TradeQL Indicator is a customizable tool that highlights specific trading patterns on candlestick charts. Users can define patterns through TradeQL queries, which the indicator then applies to the chart, visually representing matches and captured groups. Ideal for identifying complex trade setups in real-time.
TradeQL queries are specified using the TradeQL Language. See https://github.com/abdielou/tradeql for more details. This language is expressed as a regular expression. The language a
Are you tired of drawing trendlines every time you're analyzing charts? Or perhaps you would like more consistency in your technical analysis. Then this is for you. This indicator will draw trend lines automatically when dropped on a chart. How it works Works similar to standard deviation channel found on mt4 and mt5. It has 2 parameters: 1. Starting Bar 2. Number of bars for calculation The starting bar is the bar which drawing of the trend lines will begin, while the number of bars for c
SIMPLE AND QUICK CHART CLEANUP SCRIPT - FREE FOR ALL - EASY TO DRAG AND DROP ONTO THE CHART - A MUST HAVE IN MY EYES
Everybody loves to draw on a chart! But cleaning is nobodies favor. Most of the time it will be faster to dump all and redraw the important part. Repetition makes you good! ALWAYS think about that! KEEP IT GROWING, ;-) I wish you a good day, Traders!
If you need something, send me a message. Best wishes to you from Vienna!
This indicator is very useful for day traders or short term traders. (MT5 version) No need to calculate the number of pips manually, just look at the chart and you will see the Virtual Take Profit / Virtual Stop Loss target line and evaluate whether the entry point is feasible to reach the intended target or not.
Enter the intended Take Profit / Stop Loss pips for your trade. The indicator will display Virtual Take Profit / Virtual Stop Loss lines for you to easily see if the target i
Description : Rainbow MT5 is a technical indicator based on Moving Average with period 34 and very easy to use. When price crosses above MA and MA changes color to green, then this is a signal to buy. When price crosses below MA and MA changes color to red, then this is a signal to sell. The Expert advisor ( Rainbow EA MT5 ) based on Rainbow MT5 indicator is now available here .
MT4 version is available here .
The Oscar, one of my favorite indicators. This is my enhanced Version of it with more options and better visuals. Many different averaging methods Oscar changes color on signal cross, but not too volatile (3% extra threshold) Adaptable Divisor, higher numbers lead to more signals, due to higher fluctuations. Its a fast but quite accurate trend direction indicator. Play around with the settings and make it match to your setup. GL trading Please follow me on Twitter https://twitter.com/semager and
Bar Countdown is a simple indicator for MetaTrader 5 that shows the time remaining of the each candle. It can be placed in any corner of the chart or near of the price close and it'll help you to know
if the current candle is ending. Choose the counter format between HR:MIN:SEC and MIN:SEC It is so easy to use, configure the color, size and counter position on the chart and that's it!!! The Countdown starts now!
Updates: 2021/02/28; v1.0: Initial release 2021/03/16; v1.1: Minor code changes
This indicator shows current major support and resistance, if one exists. And as a support or resistance is broken it shows the new current, if any. To identify support and resistance points it uses the high and low points identified on the current chart. Allows too you to inform the maximum number of bars used to consider a support or resistance point still valid.
Time Range Separator is a useful tool to display a separator period on your platform.
You could go in the properties of the indicator, select the desired range and that's ALL. We believe it is a useful and necessary that we wish to share with you for free all our followers. Input Values: TimeFrame = Period Separator Separator_Color = Vertical Color Line Separator_Style = Vertical Color Style Separator_Width = Vertical Line Width Good trading to all and see you soon. Same indicator for MT4 her
It is the MQL5 version of zero lag MACD that was available for MT4 here: https://www.mql5.com/en/code/9993 Also there was a colored version of it here but it had some problems: https://www.mql5.com/en/code/8703 I fixed the MT4 version which has 95 lines of code. It took me 5 days to write the MT5 version.(reading the logs and testing multiple times and finding out the difference of MT5 and MT4!) My first MQL5 version of this indicator had 400 lines of code but I optimized my own code again and n
The indicator analyzes the volume scale and splits it into two components - seller volumes and buyer volumes, and also calculates the delta and cumulative delta. The indicator does not flicker or redraw, its calculation and plotting are performed fairly quickly, while using the data from the smaller (relative to the current) periods. The indicator operation modes can be switched using the Mode input variable: Buy - display only the buyer volumes. Sell - display only the seller volumes. BuySell -
The Penta-O is a 6-point retracement harmonacci pattern which usually precedes big market movements. Penta-O patterns can expand and repaint quite a bit. To make things easier this indicator implements a twist: it waits for a donchian breakout in the right direction before signaling the trade. The end result is an otherwise repainting indicator with a very reliable trading signal. The donchian breakout period is entered as an input. [ Installation Guide | Update Guide | Troubleshooting | FAQ | A
Wyckoff fans, enjoy!
Ideally to be used with the Weis Waves indicator, but it can be easily used alone, the Waves Sizer puts the range (in resulting Price movement) done by the Price on its market swings. You can control how accurate or loose will be the swings. This tool is very helpful for visually know how much the Price has traveled in your Timeframe. This way you can confront this level of effort with the resulting Volume, etc... Weis Waves indicator:
https://www.mql5.com/en/market/pro
Step into the realm of Forex trading with confidence and precision using XQ, a cutting-edge Forex indicator designed to elevate your trading game to unprecedented heights. Whether you're a seasoned trader or just stepping into the world of currency exchange, XQ Forex Indicator empowers you with the insights and signals needed to make informed trading decisions. The signal conditions are a combination of three indicators, and XQ Forex Indicator only display medium and long-term trends . The ind
The Volume by Price Indicator for MetaTrader 5 features Volume Profile and Market Profile TPO (Time Price Opportunity). Get valuable insights out of currencies, equities and commodities data. Gain an edge trading financial markets. Volume and TPO histogram bar and line charts. Volume Footprint charts. TPO letter and block marker charts including split structures. Versatile segmentation and compositing methods. Static, dynamic and flexible ranges with relative and/or absolute visualizations. Lay
Auto Order Block with break of structure based on ICT and Smart Money Concepts
Futures Break of Structure ( BoS )
Order block ( OB )
Higher time frame Order block / Point of Interest ( POI ) shown on current chart
Fair value Gap ( FVG ) / Imbalance , MTF ( Multi Time Frame )
Volume Imbalance , MTF vIMB
Gap’s Equal High / Low’s , MTF EQH / EQL
Liquidity
Current Day High / Low HOD /
Was: $299 Now: $99 Supply Demand uses previous price action to identify potential imbalances between buyers and sellers. The key is to identify the better odds zones, not just the untouched ones. Blahtech Supply Demand indicator delivers functionality previously unavailable on any trading platform. This 4-in-1 indicator not only highlights the higher probability zones using a multi-criteria strength engine, but also combines it with multi-timeframe trend analysis, previously confirmed swings
トレンドラインマップインジケーターは、トレンドスクリーナーインジケーターのアドオンです。トレンドスクリーナー(トレンドラインシグナル)によって生成されたすべてのシグナルのスキャナーとして機能します。
これは、トレンドスクリーナーインジケーターに基づくトレンドラインスキャナーです。 Trend Screener Pro インジケーターがない場合、Trend Line Map Proは機能しません。
It's a Trend Line Scanner based on Trend Screener Indicator. If you don't have Trend Screener Pro Indicator, the Trend Line Map Pro will not work .
ブログにアクセスすると、トレンドラインマップインジケーターの無料バージョンをダウンロードできます。 Metatrader Testerの制限なしで、購入する前に試してみてください。 : ここをクリック
1.簡単になる利点 通貨と時間枠に基づいて売買シグナルを表示し
The Trend Line PRO indicator is an independent trading strategy. It shows the trend change, the entry point to the transaction, as well as automatically calculates three levels of Take Profit and Stop Loss protection
Trend Line PRO is perfect for all Meta Trader symbols: currencies, metals, cryptocurrencies, stocks and indices Advantages of Trend Line PRO Never redraws its signals The possibility of using it as an independent strategy It has three automatic levels Take Profit and Stop Loss lev
Gartley Hunter Multi - An indicator for searching for harmonic patterns simultaneously on dozens of trading instruments and on all classic timeframes: (m1, m5, m15, m30, H1, H4, D1, Wk, Mn). Manual (Be sure to read before purchasing) | Version for MT4 Advantages 1. Patterns: Gartley, Butterfly, Shark, Crab. Bat, Alternate Bat, Deep Crab, Cypher
2. Simultaneous search for patterns on dozens of trading instruments and on all classic timeframes
3. Search for patterns of all possible sizes. Fr
Was: $249 Now: $99 Market Profile defines a number of day types that can help the trader to determine market behaviour. A key feature is the Value Area, representing the range of price action where 70% of trading took place. Understanding the Value Area can give traders valuable insight into market direction and establish the higher odds trade. It is an excellent addition to any system you may be using. Inspired by Jim Dalton’s book “Mind Over Markets”, this indicator is designed to suit the
TPSpro TRENDPRO - is a trend indicator that automatically analyzes the market and provides information about the trend and each of its changes, as well as giving signals for entering trades without redrawing! The indicator uses each candle, analyzing them separately. referring to different impulses - up or down impulse. Exact entry points into transactions for currencies, crypto, metals, stocks, indices! - Version MT4 DETAILED DESCRIPTION / TRADING SETUPS
Golden Spikes Detector This indicator is based on an advanced strategy primarily for trading spikes on Boom and Crash Indices. Complex algorithms were implemented to detect high probability entries only. It alerts on potential Buy and Sell entries. To trade spikes on the Deriv or Binary broker, only take Buy Boom and Sell Cash alerts. It was optimised to be loaded on 5-minute timeframe although multiple timeframe analysis is done in the background. Features · Desktop pop up and sound
Kono robotto wa idō heikin no kōsa de dōsa shimasu. Idō heikin wa kihontekini torendo o tsuiseki suru tame ni shiyō sa remasu. Idō heikin o kōsa sa seru senryaku wa, ōkina tsuyoki oyobi yowaki no ugoki o riyō suru koto o omona mokuteki to shite imasu. Subete no paramēta wa henshū kanōde tsukai yasuku, koreha jikken-tekina purojekutodesu. Kono robotto o shiyō shite chōsa o jisshi shi, mitsuketa sairyō no jōhō o watashitachi to kyōyū shite kudasai Aurélio Machado.
New candlestick alert, the alert appears according to the timeframe it is placed on. The indicator works on any asset, the alert can be silenced at any time, without the need to remove the indicator from the graph. It's great for those who can't keep an eye on the chart all the time. You can use this tool at work, college or anywhere else. It is also possible to receive signals directly on your cell phone by connecting to the metatrader. Aurélio Machado.
Injikētā wa, kaku chāto jikan no muttsu no shingō nimotozuite, onaji shisan no itsutsu no kotonaru chāto jikan no torendo o tsuiseki shimasu. Shihyō no omona mokuteki wa, sore ga oka reta kin'yū shisan no dai tasū no keikō o shimesu kotodesu. Shisutemu wa sū-kai no gurafikku jikan de keikō no jōhō o sōshin shimasu. Kore ni yori, yūzā wa shisan no ugoki no hiroi shiya o motsu koto ga dekimasu. Kono taipu no tsūru wa, operētā ga chūmon o jikkō suru no o shien suru koto de, yūzā no hitto-ritsu o ta
RSI Robot Easy kono kanzen ni kōsei kanōna robotto wa, RSI injikētā o bēsu to shite shiyō shite chūmon o jikkō suru koto o mokuteki to shite imasu. Kawa re sugi no ryōiki ni hairu toki, oyobi/ matawa ura re sugi no ryōiki o hanareru toki ni, entori ga hassei suru ka dō ka o sentaku suru koto ga kanōdesu. Ichido ni sutoppurosu to teikupurofitto, oyobi saidai chūmon-sū o settei suru koto ga kanōdesu.
Полезный информационный индикатор. Спасибо автору.