• 概要
  • レビュー
  • コメント
  • 最新情報

Spike Detector

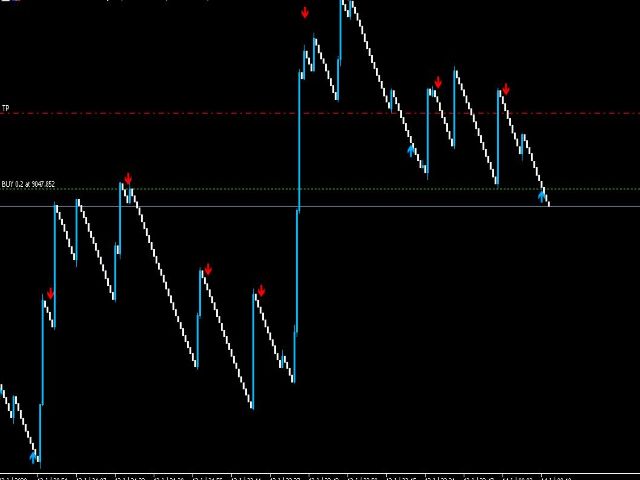
this indicator is a Spike detector indicator,

it is specially designed to trade Boom 1000, Boom 500, Crash 1000 and Crash 500

We recommend using it on Deriv Boom and Crash indices only

Its setting is intuitive, familiar, easy to use

it has notification functions; audible notifications and push notifications.

this tool is simple to use, easy to handle

This update is based on different strategies for spikes

おすすめのプロダクト
An indicator of patterns #39 and #40 ("Rounding Tops" and "Rounding Bottoms") from Encyclopedia of Chart Patterns by Thomas N. Bulkowski. Parameters: Alerts - show alert when an arrow appears  Push - send a push notification when an arrow appears (requires configuration in the terminal) PeriodBars - indicator period   K - an additional parameter that influences the accuracy of pattern shape recognition. Changes from 0 to 1 ArrowType - a symbol from 1 to 17 ArrowVShift - vertical shift of arrows
This indicator is a scalping indicator intended solely for the Boom and Crash indices of the Deriv Limited market It supports Boom 500, Boom 1000, Crash 500 and Crash 1000 Not repaint and no bug The settings are intuitive and easy to use The product activation number is 20 The Time Frame used depends on the user If you are an aggressive scalper then just use M1 For long trades use M15 If you are conservative use M5 Please contact me for more details of its use
Prozone IntraWeek
Renfred Dodzidenu Semabia
Discover Prozones IntraWeek MT5: Elevate Your Trading Success with Precision Are you tired of sifting through market noise in search of profitable trades? Look no further than Prozones IntraWeek MT5 – your ultimate solution for consistent trading success in the fast-paced world of intraday trading. Crafted with advanced algorithms and years of market expertise, this indicator empowers traders of all levels to make informed decisions with confidence. Key Features:     Pinpoint Precision
Expert. Automatic and manual trading. Ready-made trading system based on Elliott waves and Fibonacci retracement levels . It is simple and affordable. Display of the marking of Elliott waves (main or alternative option) on the chart. Construction of horizontal levels, support and resistance lines, a channel. Superposition of Fibonacci levels on waves 1, 3, 5, A Alert system (on-screen, E-Mail, Push notifications).    visual panel for opening orders in manual trading. visual panel for setting up
Классификатор силы тренда. Показания на истории не меняет. Изменяется классификация только незакрытого бара. По идее подобен полной системе ASCTrend, сигнальный модуль которой, точнее его аппроксимация в несколько "урезанном" виде, есть в свободном доступе, а также в терминале как сигнальный индикатор SilverTrend . Точной копией системы ASCTrend не является. Работает на всех инструментах и всех временных диапазонах. Индикатор использует несколько некоррелируемых между собой алгоритмов для класси
Elliott Wave Trend was designed for the scientific wave counting. This tool focuses to get rid of the vagueness of the classic Elliott Wave Counting using the guideline from the template and pattern approach. In doing so, firstly Elliott Wave Trend offers the template for your wave counting. Secondly, it offers Wave Structural Score to assist to identify accurate wave formation. It offers both impulse wave Structural Score and corrective wave Structure Score. Structural Score is the rating to sh
WAPV Weis Wave Chart Forex
Eduardo Da Costa Custodio Santos
The Weis Wave Chart Forex for MT5 is a Price and Volume indicator. The Price and Volume reading was widely disseminated through Richard Demille Wyckoff based on the three laws created by him: Supply and Demand, Cause and Effect and Effort vs. Result. In 1900 R.Wyckoff already used the wave chart in his analyses. Many years later, around 1990, David Weis Automated R. Wyckoff's wave chart and today we bring you the evolution of David Weis' wave chart. It shows the amount of Volume and the amount o
The XR Gartley Pattern MT5 is an indicator which displays and alerts Gartley pattern detected on the candlestick chart. It also displays potential trade with calculated Take Profit and Stop Loss. After purchasing XR Gartley Pattern Indicator, you can immediately download this indicator from the MT4-MT5 Market and start using it because all features are set to default, is not necessary to change any parameter. In addition, we have created a  private group  for customers who have purchased one of
FREE
Introduction to Double Harmonic Volatility Indicator Use of the Fibonacci analysis for financial trading can nearly go back to 85 years from today since the birth of Elliott Wave Theory by R. N. Elliott. Until now, traders use the Fibonacci analysis to identify the patterns in the price series. Yet, we could not find any one attempted to use Fibonacci analysis for the Volatility. Harmonic Volatility Indicator was the first technical analysis applying the Fibonacci analysis to the financial Volat
Based on the trading model/strategy/system of gold double-position hedging and arbitrage launched by Goodtrade Brokers, problems encountered in daily operations: 1. Account B immediately places an order immediately following account A. 2: After account A places an order, account B will automatically copy the stop loss and take profit. 3: Account A closes the position of Account B and closes the position at the same time. 4: When account B closes the position, account A also closes the position.
Индикатор "Benefit Predictor" Это высокоточный инструмент для прогнозирования разворота цены на любом финансовом инструменте и любом таймфрейме. Этот продукт появился благодаря годам опыта и исследований в области анализа цен и других временных рядов, используя продвинутые методы машинного обучения и математического анализа. Особенности продукта : Готовая торговая система, подходит как для ручной торговли, так и для использования в торговых роботах. Не перерисовывается после появления сигна
Analyze potential   Covered Call   structures in the Brazilian market. Define where you want the break-even of your structure and see what structure to use. It works for any asset that has authorized series of options on B3 (Brazilian Stock Exchange). Associate the indicator to the asset you want to set up the Covered Call. *** ATENTION *** For the robot to work, the service that consults the authorized series of B3 options must be running on your terminal. Download the utility for free from
FREE
TrendOnCloseは、特定のローソク足サイクル内のトレンドとカウンター トレンドの統計分析に焦点を当てた、バイナリー市場投資家向けの高度 なインディケータです。 各サイクル は、ローソク足の終値によって定義され、次のサイクルが始まるまでの間、トレン ド方向(UP/DOWN - BULL/BEAR)を確立します。統計分析は2つの構成で行われます: ⦁ SUBSEQUENT CANDLEとしての統計目標: アルゴリズムは、サイクル内の後続のローソク足に焦点を当てます。 ⦁ INTERCYCLESとしての統計ゴール: アルゴリズムは、各サイクル間のすべてのローソク足を考慮する。 選択された統計目標に基づき、各ローソク足のトレンドがCYCLEローソク足のトレンドと比較され、同一方向の場合はTREND-Percent(TD)とTrend-Occurrences(N-TD)が増加し、トレンドが乖離している場合はCOUNTER-TREND(CTとN-CT)が増加します。さらに、このインジケータは、日足、週足、月足の統計的な合計を提供し、これらの期間中、各サイクル の「トレンド」ま
HWAFM
Aleksandr Chugunov
HWAFM (the harmonic wave analysis of the financial markets) Harmonic trading involves searching for certain price patterns (specimens) and Fibo numbers in order to define highly probable price reversal points. The method is based on the assumption that trade patterns or cycles repeat themselves just like in real life. The main objective is to identify these patterns, as well as position entries/exits. The analyzer is based on a high degree of probability, which is confirmed by the price movement
Trend and Signals MT5  indicator scans  30 trading Instruments (Forex, Metals and Indices).     It uses special algorithm on the  current market   based on   Pure Price Action   and display the overall trend and signal on the dashboard. When signals are produced the indicator sends alert and notification. Strategy for Signals This indicator uses the daily timeframe to determine the direction of the trend. The hourly timeframe is used to identify possible entries. Main trend and is determined by
Micro  ******************* Секундные графики MT5 ********************** Более точного инструмента для входа в сделку вы не найдёте. Входные параметры: Timeframe, sek - период построения графика, секунды Displayed bars - отображаемые бары Step of price levels, pp, 0-off - шаг отрисовки ценовых уровней, пункты Scale points per bar, 0-off - масштаб в пунктах на бар Show lines - отображение текущих уровней Show comment - отображение комментария Standard color scheme - стандартная цветовая сх
Saving data from the order book. Data replay utility: https://www.mql5.com/en/market/product/71640 Library for use in the strategy tester: https://www.mql5.com/en/market/product/81409 Perhaps, then a library will appear for using the saved data in the strategy tester, depending on the interest in this development. Now there are developments of this kind using shared memory, when only one copy of the data is in RAM. This not only solves the memory issue, but gives faster initialization on each
Good day! I present to you a trading technical indicator for Deriv broker synthetic indices. This indicator ONLY works with the following indices: Boom 300 Index Boom 500 Index Boom 1000 Index Crash 300 Index Crash 500 Index Crash 1000 Index The indicator was created to give signals to open medium-term trades in the direction of Spikes. But you can open trades in the opposite direction to Spikes, at your own risk. Trade only on M1. Other TFs do not guarantee the correct operation of the indic
Limitless MT5 is a universal indicator suitable for every beginner and experienced trader. works on all currency pairs, cryptocurrencies, raw stocks Limitless MT5 - already configured and does not require additional configuration And now the main thing Why Limitless MT5? 1 complete lack of redrawing 2 two years of testing by the best specialists in trading 3 the accuracy of correct signals exceeds 80% 4 performed well in trading during news releases Trading rules 1 buy signa
The Smooth Price technical indicator is used for plotting a smoothed line as close to the price of the financial instrument as possible, and serves to eliminate its noise components. The indicator is part of the Monarch trading system, but here it is presented as an independent technical analysis tool. The indicator is based on the cluster digital filter , which, unlike the ClusterSMA , is applied directly to the price time series. Smooth Price does not redraw (except the very last, zero bar) an
When it comes to trading in the financial markets, there's no question that the banks have a major advantage. They have access to vast amounts of resources, including high-powered trading algorithms, in-depth market research, and teams of experienced traders. But what if you could level the playing field and trade like the banks do? That's exactly what our Smart Money Indicator allows you to do. By providing you with critical insights into market structure and supply and demand zones, you can ma
Introduction to Chart Pattern MT Chart Pattern MT is a chart pattern scanner to detect the triangle pattern, falling wedge pattern, rising wedge pattern, channel pattern and so on. Chart Pattern MT uses highly sophisticated chart pattern detection algorithm. However, we have designed it in the easy to use with intuitive user interface. Chart Pattern MT will show all the patterns in your chart in the most efficient format for your trading. You do not have to do tedious manual pattern detection an
Rule Plotter Expert
Francisco Gomes Da Silva
5 (1)
この専門家アドバイザーは、 Rule Plotter インジケーター内で作成された戦略をテストおよび実行するために設計されています。 使用方法: Rule Plotter - プログラミング不要のトレードシステムを作成するツール を無料でダウンロードしてください。 次に、Rule Plotter インジケーターで戦略を開発してください。 最後に、この専門家アドバイザーを使用して作成した戦略を実行してください。 パラメータ: Strategy : Rule Plotter インジケーター内で作成したトレードシステムです。 Lot: 取引量。0に設定すると、専門家アドバイザーは最小取引量で取引します。 Take: 利益を取るティック数。0に設定すると、取引に利益を取らないことを意味します。 Stop: 損失を止めるティック数。0に設定すると、取引に損失を止めないことを意味します。 Magic ID: このパラメータを使用すると、同じアセットでこの専門家アドバイザーの複数のバージョンを実行でき、Magic ID番号だけを変更すればよくなります。 新しいプロジェクトを公開したときに通知を受ける
Introducing the Power Trade Plus indicator designed by a small group of traders with a few years of experience trading the market profitably.  The Power Trade Plus is derived from the Power Trade indicator,  the indicator strive in powerful sniper entries and take profit levels,  with an algorithm that's can determine the markets volatility and Provides entries based on the current market volatility. This indicator is much more effective in stock ,currencies and indices.
Win43 Scalper
Eadvisors Software Inc.
O novo s43 Scalper para Mini-Índice (WIN-IND) faz operações de curto prazo no timeframe 1min buscando pequenas variações do mercado, utiliza nova tecnologia de trade, os resultados no intraday são íncríveis, confira:      Após a instalação adicione no gráfico dos instrumentos win para visualizar os resultados no backteste. Recomendamos o timeframe de 1min.
Indicator show best signals for buy and sell orders. Indicator uses only 2 inputs: DEMA Fast Period  -   fast   double exponential moving average period DEMA Slow Period  -   slow   double exponential moving average period Crossings of fast and slow double  double exponential moving averages shows buy and sell signals, which are drawn as green and magenta arrows respectively.
The Wall Street Player (Master version). This EA tailored as a Discipline, Money and Risk Management tool is a powerful Trade Station utility designed for Forex, Cryptos, Commodities, Shares, Deriv synthetic pairs and any CFDs Market. It is designed to fit your strategy as a winner, and take your Edge of the market to the NEXT-LEVEL. The only thing to do is to get It on your chart and appreciate the possibilities and chart management abilities it has to offer for realizing that discipline and a
Surf Board
Mohammadal Alizadehmadani
Benefits of the Surfboard indicator : Entry signals without repainting If a signal appears and is confirmed, it does NOT disappear anymore, unlike indicators with repainting, which lead to major financial losses because they can show a signal and then remove it. perfect opening of trades The indicator algorithms allow you to find the Peak and floor position to enter a deal (buy or sell an asset), which increases the success rate for each and every trader using it. Surfboard works with any asse
An oscillator that shows price changes and identifies areas of overbought and oversold. It can also show trend reversal points. WaveTrend Oscillator is a port of a famous TS /MT indicator. When the oscillator is above the overbought band (red lines) and crosses down the signal (solid line), it is usually a good SELL signal. Similarly, when the oscillator crosses above the signal when below the Oversold band (green lines), it is a good BUY signal. Good luck.
An indicator of patterns #32 and #33 ("Measured Move Up/Down") from Encyclopedia of Chart Patterns by Thomas N. Bulkowski. Parameters: Alerts - show alert when an arrow appears   Push - send a push notification when an arrow appears (requires configuration in the terminal) PeriodBars - indicator period MinMovment - minimum movement value (in points) BackMovment - maximum value of return movement (as decimals) ArrowType - a symbol from 1 to 17 ArrowVShift - vertical shift of arrows in points   Sh
このプロダクトを購入した人は以下も購入しています
Recommended TimeFrame >= H1. 100% Non Repainted at any moment.  Use it carefully, only with Trend Direction. Trading Usage: 2 Variants: as Range System or as BreakOut System (Both Only With Trend Direction)::: (Always use StopLoss for minimise Risk); [1] as Range System: (Recommended) in UP TREND:  - BUY in Blue Line , then if price goes down by 50 points (on H1) open Second BUY.   Close in any Profit you wish: TrailingStop(45 points) or Close when Price touches upper Gold Line. in DOWN TR
This indicator is based on the crossing of two Moving Average with the RSI It is intended for scalpers Specially designed for Boom and Crash syhtetic indices from Binary.com/Deriv.com It is easy to use and intuitive. We recommend its use on M1 and is equipped with three types of notification Email alert Sound notification Push notification these parameters can be activated and deactivated.
4つのアンサンブルに分割された12の人工ニューラルネットワーク 将来の価格変動の方向性を予測しようとしています: 小:1分、 中:5分、 大:30分、 ロイヤル:15分。 アクティブな高頻度取引のこのインジケーターは、すぐに使用できます EAは個別に起動され、インジケーターによって公開されたグローバル変数の形式でインジケーターからシグナルを受信します。 このインジケーターはストラテジーテスターでは機能しないため、ビデオを見るか、 1週間に限定された試用版のデモ版を提供するという要件を記載したリクエストを私のメールに書いてください。 tgwls2@gmail.com このプログラムは64ビットバージョンであり、コンピュータが OpenCLアクセラレータバージョン2.0以降をサポートし、 少なくとも8GBのRAMと最新のプロセッサ。 予測は、メインチャートウィンドウの右側に矢印として表示されます。 小さな期間-小さな矢印、大きなもの-大きなもの。 王室のアンサンブルには独自の矢印があります。 現在のバーに対する矢印の色とオフセットを変更できます メインウィンドウの右側、およびその他の
MMM Gold Sniper MT5
Gilang Wardhana Purnama Putra
Indicator is based on   Market Maker Strategy.   NO REPAINT. MM's are traders and their objective is to make money.  This includes strategies to trade against retails traders.  The major difference between them and other traders is that they have the ability, through access to massive volumes, to move price at their will.  So to make money, they aim to buy at a lower price and then sell at a higher price. They achieve this by:  1. Inducing traders to take positions. This is achieved by using a
Jeslyn MT5
Justine Kelechi Ekweh
これは、スキャルパー システムまたは非常に強い勢いに乗るして、FXによって使用される両方に適した多目的システムです。 Jeslyn 。シンプルな矢印インジケーターのように見えるかもしれませんが、洗練された論理的なアルゴリズムが組み込まれています。他の指標から計算を引き出すのではなく、価格変動のみに基づいて計算します。トレンド、勢いとの違い、ダイバージェンスと出来高スプレッド分析の関係を解釈する方法を見つけました。勢いよくポジションが埋まるミニ供給ゾーンと需要ゾーンがあり、これらは開始時に私たちが希望する場所です。また、メタトレーダーでは実際の出来高を取得できないとも言われていますが、私はそれを取得し、価格の勢いで操作する方法を見つけました。ボリューム、勢い、広がりがこの調理済みの食事の秘密のJeslynてています。シンプルな矢印インジケーターのように見えるかもしれませんが、洗練された論理的なアルゴリズムが組み込まれています。他の指標から計算を引き出すのではなく、価格変動のみに基づいて計算します。トレンド、勢いとの違い、ダイバージェンスと出来高スプレッド分析の関係を解釈する方
Make Sure to Read the Description! UT Bot Plus contains free EA! The EA can be downloaded from telegram channel:  https://t.me/ +NSOJTvH39fNhZmU0 Unlock the Power of Automated Trading with UT BOT Indicator, Integrated with a FREE EA! ( Limited time offer ) This version has been expanded to include multiple additional filtering options. These options are fully configurable and can be switched on and off. This versatile UT BOT indicator is crafted and optimized to work seamlessly with the
まず第一に、このトレーディングシステムがノンリペイント、ノンリドロー、ノンラグのインジケーターであることを強調する価値がある。これにより、手動取引とロボット取引の両方に理想的なものになっています。 「スマートトレンドトレーディングシステム MT5」は、新規および経験豊富なトレーダー向けにカスタマイズされた包括的なトレーディングソリューションです。10以上のプレミアムインジケーターを組み合わせ、7つ以上の堅実なトレーディング戦略を備えており、多様な市場状況に対応する多目的な選択肢となっています。 トレンドフォロー戦略:トレンドを効果的に乗り越えるための正確なエントリーとストップロス管理を提供します。 リバーサル戦略:潜在的なトレンドの反転を特定し、トレーダーがレンジ相場を活用できるようにします。 スキャルピング戦略:高速で正確なデイトレードおよび短期取引のために設計されています。 安定性:すべてのインジケーターはノンリペイント、ノンリドロー、ノンラグであり、信頼性の高いシグナルを保証します。 カスタマイズ:個々の取引の嗜好に合わせたカスタム戦略をサポートします。7つ以上の戦略と組み合わせ
まず第一に、この取引インジケーターは再描画されず、再描画されず、遅延しないことを強調する価値があります。これにより、手動取引とロボット取引の両方に理想的なものになります。 アトミックアナリストは、価格の強さとモメンタムを利用して市場でより良いエッジを見つけるためのPA価格アクションインジケーターです。ノイズや誤ったシグナルを除去し、取引ポテンシャルを高めるための高度なフィルターを備えています。複雑なインジケーターの複数のレイヤーを使用して、アトミックアナリストはチャートをスキャンし、複雑な数学的計算をシンプルなシグナルと色に変換します。これにより、どのような初心者トレーダーでも理解して使用し、一貫した取引の決定を行うことができます。 「アトミックアナリスト」は、新規および経験豊富なトレーダー向けにカスタマイズされた包括的な取引ソリューションです。プレミアムインジケーターとトップノッチの機能を1つの取引戦略に組み合わせ、すべてのタイプのトレーダーにとって汎用性のある選択肢にします。 デイリートレーディングとスキャルピング戦略:高速で正確なデイトレーディングおよび短期トレード
ご紹介   クォンタム トレンド スナイパー インジケーターは 、トレンド反転を特定して取引する方法を変革する画期的な MQL5 インジケーターです。 13年以上の取引経験を持つ経験豊富なトレーダーのチームによって開発されました。     クォンタムトレンドスナイパーインジケーター   は、非常に高い精度でトレンドの反転を識別する革新的な方法で、あなたのトレーディングの旅を新たな高みに押し上げるように設計されています。 ***Quantum Trend Sniper Indicatorを購入すると、Quantum Breakout Indicatorを無料で入手できます!*** クォンタム ブレイクアウト インジケーターは、トレンドの反転を特定するとアラートを発し、矢印を示し、3 つのテイクプロフィットレベルを提案します。 初心者トレーダーにもプロのトレーダーにも適しています。 量子EAチャネル:       ここをクリック MT4のバージョン:       ここをクリック 推奨事項: 期間:すべての時間枠。最良の結果を得るには、M
FX Volume MT5
Daniel Stein
4.94 (17)
mql5と Telegramの モーニング・ブリーフィングで、詳細とスクリーンショットを含む毎日のマーケット・アップデートをご覧 ください! FX Volumeは、ブローカーの視点から市場のセンチメントをリアルに洞察する、最初で唯一の出来高インジケーターです。 ブローカーのような機関投資家が外国為替市場でどのようなポジションをとっているか、COTレポートよりもはるかに速く、素晴らしい洞察を提供します。 この情報をチャート上で直接見ることは、あなたの取引にとって真のゲームチェンジャーであり、画期的なソリューションです。 以下のようなユニークなマーケットデータ洞察から利益を得てください。 比率は 、通貨のロングポジションとショートポジションの比率をパーセントで表示します。 比率の変化は 、選択した期間内のロング比率とその変化率を表示します。 Volumes Totalは 、通貨の取引量(ロングとショート)の合計をロット単位で表示します。 Volumes Long :全通貨のロングポジションの取引量を表示します。 Volumes(ショート )は、全通貨のショートポジションの取引量を表示
トレンド スクリーナー インジケーターでトレンド取引の力を解き放ちます。ファジー ロジックと複数通貨システムを活用した究極のトレンド取引ソリューションです。 ファジー ロジックを活用した革新的なトレンド インジケーターである Trend Screener を使用して、トレンド取引を向上させます。 これは、13 を超えるプレミアム ツールと機能、および 3 つの取引戦略を組み合わせた強力なトレンド追跡インジケーターであり、Metatrader をトレンド アナライザーにする多用途の選択肢となります。 期間限定オファー : トレンド スクリーナー インジケーターは、わずか 50 ドルで生涯ご利用いただけます。 (元の価格 125$ ) (オファー延長) Trend Screener の 100% 非再描画精度の揺るぎない精度を体験して、取引の決定が過去の価格変動の影響を受けないようにしてください。 マルチタイムフレームおよびマルチ通貨機能の多用途性を解放し、比類のない自信を持って外国為替、商品、暗号通貨、インデックスの世界を取引できるようにします。 Trend Screener の包括的な
Gold Stuff mt5
Vasiliy Strukov
4.89 (166)
Gold Stuff mt5 は、金専用に設計されたトレンド指標であり、あらゆる金融商品にも使用できます。 インジケーターは再描画せず、遅れません。 推奨時間枠 H1. 設定と個人的なボーナスを得るために、購入後すぐに私に連絡してください!   設定 矢印を描く - オンオフ。 チャートに矢印を描く。 アラート - 可聴アラートのオンオフ。 メール通知 - オンオフ。 電子メール通知。 プチ通知 - オンオフ。 プッシュ通知。 次に、色域を調整します。 Gold Stuff mt5 は、金専用に設計されたトレンド指標であり、あらゆる金融商品にも使用できます。 インジケーターは再描画せず、遅れません。 推奨時間枠 H1. 設定と個人的なボーナスを得るために、購入後すぐに私に連絡してください!   設定 矢印を描く - オンオフ。 チャートに矢印を描く。 アラート - 可聴アラートのオンオフ。 メール通知 - オンオフ。 電子メール通知。 プチ通知 - オンオフ。 プッシュ通知。 次に、色域を調整します。
まず第一に、この取引ツールはノンリペイント、ノンリドロー、ノンラグの指標であり、プロの取引に理想的ですことを強調する価値があります。 スマートプライスアクションコンセプトインジケーターは、新米から経験豊富なトレーダーまで、非常 に強力なツールです。Inner Circle Trader AnalysisやSmart Money Concepts Trading Strategiesなど、20以上の有用な指標を1つに組み合わせています。このインジケーターはスマートマネーコンセプトに焦点を当て、大手機関の取引方法を提供し、彼らの動きを予測するのに役立ちます。 特に、流動性分析に優れており、機関がどのように取引しているかを理解しやすくしています。市場のトレンドを予測し、価格の動きを慎重に分析するのに優れています。機関の戦略とトレードを合わせることで、市場の動向についてより正確な予測ができます。このインジケーターは多目的であり、市場構造を分析し、重要な注文ブロックを特定し、さまざまなパターンを認識するのに優れています。 このインジケーターはBOSやCHoCHなどのパターンの識
mql5と Telegramの モーニング・ブリーフィングで、詳細とスクリーンショットを含む毎日のマーケット・アップデートをご覧 ください! FX Power MT5 NGは 、長年の人気を誇る通貨強度計FX Powerの次世代モデルです。 この次世代ストレングスメーターは何を提供するのでしょうか?初代FXパワーの魅力すべて プラス GOLD/XAUの強さ分析 より正確な計算結果 個別に設定可能な分析期間 カスタマイズ可能な計算上限値により、さらに優れたパフォーマンスを実現 もっと見たい人のための特別なマルチインスタンス設定 すべてのチャートでお好みの色を無限に設定可能 数え切れないほどの通知オプションにより、重要なことを見逃すことはありません。 Windows 11とmacOSのスタイルで角を丸くした新しいデザイン 魔法のように動くインジケーターパネル FXパワーの主な機能 すべての主要通貨の強さの完全な履歴 すべての時間枠における通貨の強さの履歴 すべてのブローカーとチャートで同一の計算結果 100%信頼できるリアルタイム計算 -> リペイントなし ドロップダウン・リストから
現在33%オフ 初心者にもエキスパートトレーダーにも最適なソリューション このインジケーターは独自の機能と新しい公式を多数内蔵しており、ユニークで高品質かつ手頃な取引ツールです。このアップデートでは、2つの時間枠ゾーンを表示できるようになります。より長いTFだけでなく、チャートTFとより長いTF(ネストゾーンを表示)の両方を表示できます。すべてのSupply Demandトレーダーの皆さんのお気に召すはずです。:) 重要情報の公開 Advanced Supply Demandの可能性を最大化するには、 https://www.mql5.com/ja/blogs/post/720245 にアクセスしてください。   エントリーまたはターゲットの正確なトリガーポイントを正確に特定できれば取引がどのように改善されるか想像してみてください。新しい基盤となるアルゴリズムに基づいて構築されているため、買い手と売り手の間の潜在的な不均衡をさらに簡単に特定できます。これは、最も強い需要と供給のゾーンと、過去のパフォーマンス(古いゾーンを表示)がグラフィカルに表現されるためです。これらの機能は、最適
今、147ドル(いくつかの更新後に499ドルに増加します) - 無制限のアカウント(PCSまたはMac) RelicusRoad ユーザー マニュアル + トレーニング ビデオ + プライベート Discord グループへのアクセス + VIP ステータス 市場の新しい見方 RelicusRoad は、外国為替、先物、暗号通貨、株式、および指数の世界で最も強力な取引インジケーターであり、トレーダーに収益を維持するために必要なすべての情報とツールを提供します。初心者から上級者まで、すべてのトレーダーが成功するためのテクニカル分析と取引計画を提供します。これは、将来の市場を予測するのに十分な情報を提供する重要な取引指標です。意味をなさないチャート上のいくつかの異なる指標ではなく、完全な解決策を信じています.これは、信号、矢印 + 価格アクション情報を表示するオールインワンのインジケーターで、他に類を見ない非常に正確です。 強力な AI に基づいて、RelicusRoad は不足している情報とツールを提供して、あなたを教育し、トレーディングのプロ、成功したトレーダーにします。
Step into the realm of Forex trading with confidence and precision using XQ, a cutting-edge Forex indicator designed to elevate your trading game to unprecedented heights. Whether you're a seasoned trader or just stepping into the world of currency exchange, XQ Forex Indicator empowers you with the insights and signals needed to make informed trading decisions. The signal conditions are a combination of three indicators, and XQ Forex Indicator only display  medium and long-term trends . The ind
The Volume by Price Indicator for MetaTrader 5 features Volume Profile and Market Profile TPO (Time Price Opportunity). Get valuable insights out of currencies, equities and commodities data. Gain an edge trading financial markets. Volume and TPO histogram bar and line charts. Volume Footprint charts. TPO letter and block marker charts including split structures. Versatile segmentation and compositing methods. Static, dynamic and flexible ranges with relative and/or absolute visualizations. Lay
Auto Order Block with break of structure based on ICT and Smart Money Concepts Futures Break of Structure ( BoS )             Order block ( OB )            Higher time frame Order block / Point of Interest ( POI )    shown on current chart           Fair value Gap ( FVG ) / Imbalance   ,  MTF      ( Multi Time Frame )    Volume Imbalance     ,  MTF          vIMB Gap’s Equal High / Low’s     ,  MTF             EQH / EQL Liquidity               Current Day High / Low           HOD /
これはMT5のインジケーターで、再描画なしで取引に参入するための正確なシグナルを提供します。 外国為替、暗号通貨、金属、株式、インデックスなど、あらゆる金融資産に適用できます。かなり正確な見積もりを提供し、取引を開始して終了するのに最適な時期を教えてくれます。1つのシグナルを処理しただけでインジケーターの元が取れた例の 動画 (6:22)をご覧ください。Entry PointsPro インジケーターの助けを借りたほとんどのトレーダーの最初の1週間の結果が改善しています。 Telegramグループ に登録してください。Entry Points Proインジケーターのメリットは次の通りです。 再描画のないエントリーシグナル 再描画されるインジケーターでは一度表示されたシグナルが削除されて大きな金銭的損失につながることがありますが、これと異なり、表示されて確認されたシグナルは消えることがありません。 エラーなしの取引開始 インジケーターアルゴリズムによって取引を開始する(資産を売買する)理想的な瞬間を見つけることができます。それを使用するすべてのトレーダーの成功率が向上します。
ICT, SMC, SMART MONEY CONCEPTS, SMART MONEY, Smart Money Concept, Support and Resistance, Trend Analysis, Price Action, Market Structure, Order Blocks, BOS/CHoCH,   Breaker Blocks ,  Momentum Shift,   Supply&Demand Zone/Order Blocks , Strong Imbalance,   HH/LL/HL/LH,    Fair Value Gap, FVG,  Premium  &   Discount   Zones, Fibonacci Retracement, OTE, Buy Side Liquidity, Sell Side Liquidity, BSL/SSL Taken, Equal Highs & Lows, MTF Dashboard, Multiple Time Frame, BigBar, HTF OB, HTF Market Structure
ブレーカートレーダーになり、価格が反転すると市場構造からの利益が変化します。 注文ブロックブレーカーインジケーターは、トレンドまたは価格の動きが枯渇に近づいており、逆転の準備ができていることを識別します。通常、反転または大規模なプルバックが発生しようとしているときに発生する市場構造の変化について警告します。 この指標は、ブレイクアウトと価格の勢いを識別する独自の計算を使用します。使い果たされる可能性のあるポイントの近くで新しい高値が形成されるたびに、インディケーターはその高値の作成を担当する最後の注文ブロックを描きます。次に、移動する価格とともに注文ブロックを追跡します。その後、価格が反対方向にシフトし、その注文ブロックを突破すると、新しい市場構造を作成し、トレンドまたは大きな後退の可能性のある反転の開始を警告します。 注文ブロックは、高値/安値が作成される前の最後の反対色のろうそくであり、価格がこれらの重要な領域を下抜けすると、トレンドの短期的ま​​たは長期的な反転の兆候です。 特徴 重要な枯渇点での市場構造の変化を警告します 価格が使い果たされるレベルに近づくと、
Was: $299  Now: $99   Supply Demand uses previous price action to identify potential imbalances between buyers and sellers. The key is to identify the better odds zones, not just the untouched ones. Blahtech Supply Demand indicator delivers functionality previously unavailable on any trading platform. This 4-in-1 indicator not only highlights the higher probability zones using a multi-criteria strength engine, but also combines it with multi-timeframe trend analysis, previously confirmed swings
Gannスクエアインジケーターは、W.D. Gannによって執筆された「市場予測のための数学的な式」の記事に基づく強力な市場分析ツールです。このツールは、解析に数学的な概念を応用し、Gann理論に基づいています。それは、144、90、52のスクエアや9のスクエアなど、Gannの関連テクニックの要素を取り入れています。さらに、の方法を組み込んでおり、9のスクエアとその関連性についてのチャネルやスターパターンに焦点を当てています。 ユーザーマニュアルと使用方法: このインジケーターを使用する前に、ユーザーマニュアルを読んで疑問点を解決するためにお問い合わせいただくことをお勧めします。ユーザーマニュアルの完全版は、当社のウェブサイトで入手できます。 MT5の完全版は購入できますし、MT4の無料版も試すことができます。両方のバージョンへのリンクを提供していますので、ご利用ください。 主な機能と機能: Gannスクエアインジケーターは、市場分析のための完全なツールセットを提供し、幾何学的な概念とGann理論に基づいて的確な判断を行う手助けをします。以下に主な機能を示します。 9のスクエアの分析:
トレンドラインマップインジケーターは、トレンドスクリーナーインジケーターのアドオンです。トレンドスクリーナー(トレンドラインシグナル)によって生成されたすべてのシグナルのスキャナーとして機能します。 これは、トレンドスクリーナーインジケーターに基づくトレンドラインスキャナーです。 Trend Screener Pro インジケーターがない場合、Trend Line Map Proは機能しません。 It's a Trend Line Scanner based on Trend Screener Indicator. If you don't have Trend Screener Pro Indicator,     the Trend Line Map Pro will not work . ブログにアクセスすると、トレンドラインマップインジケーターの無料バージョンをダウンロードできます。 Metatrader Testerの制限なしで、購入する前に試してみてください。 :  ここをクリック 1.簡単になる利点 通貨と時間枠に基づいて売買シグナルを表示し
TrendLine PRO MT5
Evgenii Aksenov
4.78 (49)
The Trend Line PRO indicator is an independent trading strategy. It shows the trend change, the entry point to the transaction, as well as automatically calculates three levels of Take Profit and Stop Loss protection Trend Line PRO is perfect for all Meta Trader symbols: currencies, metals, cryptocurrencies, stocks and indices Advantages of Trend Line PRO Never redraws its signals The possibility of using it as an independent strategy It has three automatic levels Take Profit and Stop Loss lev
ご紹介     Quantum Breakout PRO は 、ブレイクアウト ゾーンの取引方法を変革する画期的な MQL5 インジケーターです。 13年以上の取引経験を持つ経験豊富なトレーダーのチームによって開発されました。     クォンタム ブレイクアウト プロ   は、革新的でダイナミックなブレイクアウト ゾーン戦略により、あなたのトレーディングの旅を新たな高みに押し上げるように設計されています。 クォンタム ブレイクアウト インジケーターは、5 つの利益ターゲット ゾーンを備えたブレイクアウト ゾーン上のシグナル矢印と、ブレイクアウト ボックスに基づいたストップロスの提案を提供します。 初心者トレーダーにもプロのトレーダーにも適しています。 量子EAチャネル:       ここをクリック 重要!購入後、インストールマニュアルを受け取るためにプライベートメッセージを送ってください。 推奨事項: 時間枠: M15 通貨ペア: GBPJPY、EURJPY、USDJPY、NZDUSD、XAUUSD アカウントの種類: ECN、Raw、またはス
MT4版  |  FAQ Owl Smart Levels Indicator は、 Bill Williams の高度なフラクタル、市場の正しい波構造を構築する Valable ZigZag、エントリの正確なレベルをマークする Fibonacci レベルなどの一般的な市場分析ツールを含む 1 つのインジケーター内の完全な取引システムです。 利益を得るために市場と場所に。 戦略の詳細な説明 インジケータを操作するための指示 顧問-取引助手 プライベートユーザーチャット ->購入後に私に書いて、私はプライベートチャットにあなたを追加し、あなたはそこにすべてのボーナスをダウンロードすることができます 力はシンプルさにあります! Owl Smart Levels 取引システムは非常に使いやすいので、専門家にも、市場を勉強し始めて自分で取引戦略を選択し始めたばかりの人にも適しています。 戦略と指標に秘密の数式や計算方法が隠されているわけではなく、すべての戦略指標は公開されています。 Owl Smart Levels を使用すると、取引を開始するためのシグナルをすばやく確認し、注文を出すため
AW Trend Predictor MT5
AW Trading Software Limited
4.76 (54)
1 つのシステムでのトレンド レベルとブレイクダウン レベルの組み合わせ。高度なインジケーター アルゴリズムは、市場のノイズをフィルター処理し、トレンド、エントリー ポイント、および可能なエグジット レベルを決定します。インジケーターシグナルは統計モジュールに記録されるため、最適なツールを選択してシグナル履歴の有効性を示すことができます。この指標は、テイクプロフィットとストップロスのマークを計算します。 マニュアルと説明書 ->   ここ / MT4 バージョン ->   ここ インジケーターで取引する方法: Trend Predictor での取引は、たった 3 つの簡単なステップです。 ステップ 1 - ポジションを開く 70% 以上の成功率で買いシグナルが受信されました ステップ 2 - ストップロスの決定 逆信号でトランクを選択 ステップ 3 - テイクプロフィット戦略の定義 戦略 1: TP1 に到達したらポジション全体をクローズする 戦略 2: TP1 に達した時点でポジションの 50% をクローズし、TP2 に達した時点で残りの 50% をクローズします。 戦略 3:
Gartley Hunter Multi - An indicator for searching for harmonic patterns simultaneously on dozens of trading instruments and on all classic timeframes: (m1, m5, m15, m30, H1, H4, D1, Wk, Mn). Manual (Be sure to read before purchasing) | Version for MT4 Advantages 1. Patterns: Gartley, Butterfly, Shark, Crab. Bat, Alternate Bat, Deep Crab, Cypher 2. Simultaneous search for patterns on dozens of trading instruments and on all classic timeframes 3. Search for patterns of all possible sizes. Fr
作者のその他のプロダクト
the indicator will show signal arrows on the graph at the crossing of a given level it has push and audible alerts. By crossing from low to high level 0.3, a blue arrow will come out for the purchase, at the same time an audible signal will sound. By crossing from low to high level 0.7, a red arrow will come out for the sale, at the same time an audible signal will sound. Possibility to deactivate push and audible alerts. MT5 version :  https://www.mql5.com/en/market/product/51968
This Expert Advisor must be placed on a second graph; placing on a second chart it will automatically modify your orders placed without StopLoss and TakeProfit. Editable parameter; updates will be available shortly to improve its efficiency. It only has two editable entries in its parameter: (Stoploss and Takeprofit). A trailing stop function will soon be added to it.
Colored candlesticks showing the trend based on two moving averages and the slope of the slow moving average. For long term trends use Period2 = 200. Convenient to filter trends according to your trading strategy The time unit also depends on your trading style Gives you a signal for each trend, displayed on the screen coloring the candlesticks. No sound signal; no push notification; these functions will be there in the next updates
the indicator will show signal arrows on the graph at the crossing two EMA it has push and audible alerts. By crossing above each others , a blue arrow will come out for the BUY, at the same time an audible signal will sound. By crossing Below each others, a red arrow will come out for the SELL, at the same time an audible signal will sound. Possibility to deactivate push and audible alerts.
the indicator will show signal arrows on the graph at the crossing of Awesome Oscillator base level it has push and audible alerts and Email alert. By crossing above base level , a blue arrow will come out for the BUY, at the same time an audible signal will sound. By crossing Below base level, a red arrow will come out for the SELL, at the same time an audible signal will sound. Possibility to deactivate push and audible alerts. MT5 version :  Buy the 'Awesome cross MT5' Technical Indicator fo
the indicator will show signal arrows on the graph at the crossing of MACD level it has push and audible alerts. By crossing from low to high level 0, a blue arrow will come out for the BUY, at the same time an audible signal will sound. By crossing from low to high level 0, a red arrow will come out for the SELL, at the same time an audible signal will sound. Possibility to deactivate push and audible alerts. MT5 :  Buy the 'MACD Arrow' Technical Indicator for MetaTrader 5 in MetaTrader Mark
the indicator will show signal arrows on the graph at the crossing of a given level it has push and audible alerts. By crossing from low to high level 0.3, a blue arrow will come out for the purchase, at the same time an audible signal will sound. By crossing from low to high level 0.7, a red arrow will come out for the sale, at the same time an audible signal will sound. Possibility to deactivate push and audible alerts. MT4 version of this product here
ichimoku indicator with alert; audible alert, email alert, push alert you can enable or disable the settings as you wish When there is a crossing of tenkansen and kijun you will get an alert When there is a cross between Senkouspan A and Senkouspan B you will get an alert Affordable sound settings possibility to modify the parameters of the ichimoku indicator
FULL TREND KILLER is an indicator based on Bollingen Bands and it is easy to use; no internal adjustments to be made. It is specially designed for synthetic indices but also works well on Forex Assets. The best time frame to use on synthetic indices is M15, this is just a tip, however it can be used on all time frames. Settings : BANDS PERIOD Push Notification Email Notification Audible Alert
RSI Arrow1 is an arrow indicator based on the RSI, is easy to use; no internal adjustments to be made. the user can change the indicator period as desired in the settings. It can be used on all markets but it will all depend on your Trade strategy. There is no better Time Frame for its use; the use will depend on the Trader himself. Settings: RSI Period Push Notification Email Notification Audible Alert Down levels Up levels
This indicator is based on the crossing of two Moving Average with the RSI It is intended for scalpers Specially designed for Boom and Crash syhtetic indices from Binary.com/Deriv.com It is easy to use and intuitive. We recommend its use on M1 and is equipped with three types of notification Email alert Sound notification Push notification these parameters can be activated and deactivated.
This indicator is a scalping indicator intended solely for the Boom and Crash indices of the Deriv Limited market It supports Boom 500, Boom 1000, Crash 500 and Crash 1000 Not repaint and no bug The settings are intuitive and easy to use The product activation number is 20 The Time Frame used depends on the user If you are an aggressive scalper then just use M1 For long trades use M15 If you are conservative use M5 Please contact me for more details of its use
the indicator will show signal arrows on the graph at the crossing of Awesome Oscillator base level it has push and audible alerts and Email alert. By crossing above base level , a blue arrow will come out for the BUY, at the same time an audible signal will sound. By crossing Below base level, a red arrow will come out for the SELL, at the same time an audible signal will sound. Possibility to deactivate push and audible alerts. MT4 version :  Buy the 'Awesome cross' Technical Indicator for
フィルタ:
レビューなし
レビューに返信
バージョン 2.0 2021.09.17
Improved spike detection
Preferably use on M1
バージョン 1.30 2020.07.15
performance improvement