• 概要
  • レビュー (15)
  • コメント (56)
  • 最新情報

CyberZingFx Volume Plus

4.93

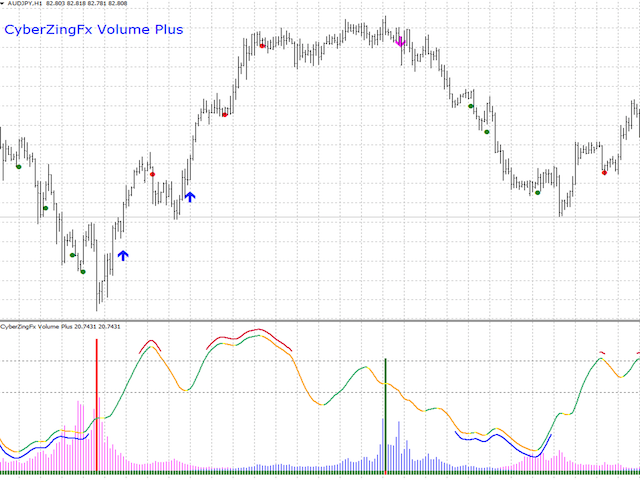
Advanced version of CyberZingFx Volume Plus, the ultimate MT4 indicator for traders seeking highly accurate buy and sell signals. With an additional strategy and price action dot signals that enhances its effectiveness, this indicator offers a superior trading experience for professionals and beginners alike.

The CyberZingFx Volume Plus Advanced version combines the power of volume analysis and historical price data with an additional strategy, resulting in even more precise and reliable signals for potential market reversals. It provides highly accurate buy and sell arrows, giving you the confidence to enter and exit trades with ease. The addition of price action dot signals further enhances the accuracy of the tool, allowing traders to make more informed decisions.

This indicator still displays the volume BUY and SELL power values on the right side of the chart, allowing you to gauge the strength of the market movements. Customizable alerts can be set at different levels, alerting you to potential market reversals at crucial times. The Alert High value displays the most recent alert value, providing valuable insights into potential market reversals.

Important :- This Indicator repaints. So make trading strategy combining other indicators.

It is important to note that the CyberZingFx Volume Plus Advanced version may repaint, so it is best used in combination with other indicators to develop a comprehensive trading strategy. For the best results, consider using it alongside the CyberZingFx Trend Reversal Indicator, which provides accurate market reversal signals.

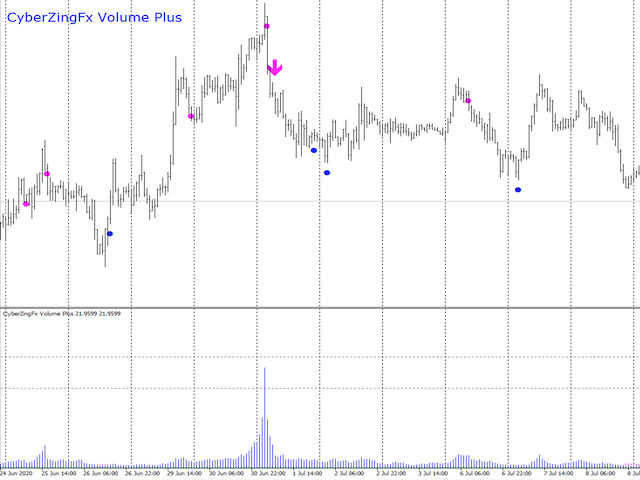
One of the most significant enhancements of the CyberZingFx Volume Plus Advanced version is the highly accurate buy and sell arrows, which are generated using an additional strategy. This feature enables traders to make informed decisions by providing accurate signals for potential market reversals.

This indicator excels at catching peak reversal prices in high timeframes, making it an essential tool for traders looking to maximize their profits. It has received excellent ratings and reviews from satisfied customers, making it a trusted tool for traders seeking an advanced and highly accurate trading experience.

Overall, the CyberZingFx Volume Plus Advanced version is the ultimate MT4 indicator for traders seeking highly accurate buy and sell signals. With its advanced strategy, customizable alerts, and additional features, this indicator provides the most accurate and reliable signals for potential market reversals, giving traders the confidence to make profitable trading decisions.


Best to find market reversals.

Best used with CyberZingFx Trend Reversal Indicator which shows accurate market reversalshttps://www.mql5.com/en/market/product/42305


After Downloading send me a message to get CyberZingFx Chart Switcher Tool which is very useful tool for traders to switch between multiple charts without opening multiple chart windows


Alert Settings

  • Popup Alert for BUY and SELL signals
  • Sound Alert for BUY and SELL signals
  • Email Alert for BUY and SELL signals
  • Mobile Notification for BUY and SELL signals


レビュー 15
mgl5fjn
267
mgl5fjn 2023.03.06 13:55 
 

just to the point effektive in conjunktion with daily, weekly and monthly support and resist, very useful!

Trusow
313
Trusow 2022.07.30 21:27 
 

Beat indicator on the market. It cost $125 for a reason. Make the small investment and it will reward you. Use it wisely as it is great at predicting tops and bottoms too

deimy
493
deimy 2022.01.05 03:32 
 

One of the best Volume indicators

おすすめのプロダクト
Forex Gump
Andrey Kozak
2.83 (6)
Forex Gump is a fully finished semi-automatic trading system. In the form of arrows, signals are displayed on the screen for opening and closing deals. All you need is to follow the instructions of the indicator. When the indicator shows a blue arrow, you need to open a buy order. When the indicator shows a red arrow, you need to open a sell order. Close orders when the indicator draws a yellow cross. In order to get the most effective result, we recommend using the timeframes H1, H4, D1. There
147 USD
Monster Harmonics Indicator is a harmonic pattern indicator. It recognizes Gartley, Bat, Crab, Butterfly, Cypher, White Swan, Black Swan, Shark and several other patterns. Projected patterns that are not yet completed are recognized, too. Monster even shows the PRZ (Potential Reversal Zone). Users can add their own user defined patterns to Monster. Besides the current pattern, Monster also shows all patterns in the symbols history. Monster will provide alerts for developing patterns. Introduced
79 USD
Red Hawk EA
Profalgo Limited
4.22 (18)
NEW PROMO: Only a few copies copies available at 349$ Next price: 449$ Get 1 EA for free! Make sure to check out our " Ultimate EA combo package " in our   promo blog ! Red Hawk is a "mean reversion" trading system, that trades during the quiet times of the market. It runs on 9 pairs currently: EURUSD, GBPUSD, USDCHF, EURCHF, EURGBP, AUCAD, AUDJPY, EURAUD and USDCAD. Recommended timeframe: M5 Since this kind of strategy works best with low spread and fast execution, I advise using an good ECN
349 USD
Trade with Gann on your side!! MASTER CIRCLE 360 CIRCLE CHART, originally created by Gann admitted that this is “The Mother of all charts”. It is one of the last studies that this great trader left for us. The numeric tab le is apparently quite simple like all the tables and is based on square numbers, the SQUARE OF 12 and is by evolution, one of the most important square numbers. Here we can find CYCLE, PRICE AND TIME thanks to angles and grades, to show past and future support and resistance.
149.99 USD
MACD Divergence Finder Indicator will help you to find Divergences between your typical MACD values and the Chart Prices as potential points of actual Trend Reversion or Pull Backs to increase your positions as per the current Trend. Indicator Windows draws MACD value and Divergence arrows but not MACD Signal as it is not considered relevant to detect this kind of Classic Divergences. In some computer/VPS with old microprocessors or low RAM size, when you launch this Indicator (attach it, change
50 USD
The principle of this indicator is very simple: detecting the trend with Moving Average, then monitoring the return point of graph by using the crossing of Stochastic Oscillator and finally predicting BUY and SELL signal with arrows, alerts and notifications. The parameters are fixed and automatically calculated on each time frame. Example: If you install indicator on EURUSD, timeframe M5: the indicator will detect the main trend with the Moving Average on this timeframe (for example the Moving
135 USD
This is a trend indicator without redrawing Developed instead of the binary options strategy (by the color of the Martingale candlestick) Also works well in forex trading When to open trades (binary options) A signal will appear in the place with a candle signaling the current candle It is recommended to open a deal for one candle of the current timeframe M1 and M5 When a blue dot appears, open a deal up When a red dot appears, open a trade down. How to open trades on Forex. When a signal is rec
1 000 USD
Auto Level this tool is able to determine the levels of support and resistance. search and display when the price has broken through the level and when it pushed off from it. the indicator can be useful if you use resistance support levels in your trading. or the highs and lows of the price, then it will greatly simplify your work and help you more quickly and more accurately determine the rebound or breakdown of the current trend or tendencies level. blue line bottom uptrend red line on top dow
500 USD
The indicator detects and displays Shark harmonic pattern (see the screenshot). The pattern is plotted by the extreme values of the ZigZag indicator (included in the resources, no need to install). After detecting the pattern, the indicator notifies of that by a pop-up window, a mobile notification and an email. The indicator highlights the process of the pattern formation and not just the complete pattern. In the former case, it is displayed in the contour triangles. After the pattern is comple
30 USD
The main idea of this indicator is rates analysis and prediction by Fourier transform. Indicator decomposes exchange rates into main harmonics and calculates their product in future. You may use the indicator as a standalone product, but for better prediction accuracy there is another related indicator - FreqoMaster - which uses FreqoMeterForecast as a backend engine and combines several instances of FreqoMeterForecast for different frequency bands. Parameters: iPeriod - number of bars in the ma
30 USD
The indicator detects and displays М. Gartley's Butterfly pattern. The pattern is plotted by the extreme values of the ZigZag indicator (included in the resources, no need to install). After detecting the pattern, the indicator notifies of that by the pop-up window, a mobile notification and an email. The pattern and wave parameters are displayed on the screenshots. The default parameters are used for demonstration purposes only in order to increase the amount of detected patterns. Parameters
30 USD
Accuracy of correct predictions 83%! This indicator was tested on the basis of real statistics for all market indicators according to indicators for 3 months of trading. 83% of correct trade forecasts for usd / jpy on the m30 time frame were received on our statistics! if you have any questions, please contact us in private messages or in discussions under this indicator and we will figure it out and help any questions will arise personal messages or in discussions under this indicator As soon
100 USD
is a trend indicator that shows the reversal and correction of a trend. This indicator consists of two combined and smoothed Exponential moving Averages using a special technique. When these EMA intersect with each other, the indicator changes its color. This allows you to visually determine the moment of the market trend change and trade on various scalping strategies. Manual settings of the indicator: MA1_Period - The period of the first indicator MA2_Period - The period of the second in
30 USD
Reversal Pattern Pro
Boonyapagorn Rodvattanajinda
Reversal Patterns Pro Reversal Patterns Pro is a Price Action (PA) analytical tool that scans the reversal patterns.  - Finds and marks the most dependable Japanese candlestick patterns in real-time. - Supports all time frames (Best for Scalping) - Doesn't repaint making it an exceptional indicator for Expert Advisors. Input parameters : - Support & Resistance Mode ( true or false ) for enabling advanced filtering - Donchian Period - RSI Period - RSI Oversold Level - RSI Overbought Level - 
50 USD
Super Gator
Agustinus Biotamalo Lumbantoruan
This indi shows the following 1. Supertrend 2. Alligator (Not a regular alligator) 3. ZigZag 4. Moving Average 5. Trend Continuation/Mini correction Signal (plotted in X) (See screenshots in green background color 6. Early Signal Detection (See screenshots in green background color) You may treat Alligator as the lagging indicator The leading indicator is the supertrend. The zig zag is based on the leading indicator where it gets plotted when the leading indicator got broken to the opposite.
150 USD
Chart Patterns Detect 15 patterns (Ascending Triangle, Descending Triangle, Rising Wedge, Falling Wedge, Bullish Flag, Bearish Flag, Bullish Rectangle, Bearish Rectangle Symmetrical triangle, Head and Shoulders, Inverted Head and Shoulders, Triple top, Triple Bottom, Double Top, Double Bottom) Use historical data to calculate the probability of each pattern to succeed (possibility to filter notification according to the chance of success) gives graphic indication about the invalidation level and
58 USD
Trend PA
Mikhail Nazarenko
5 (2)
The Trend PA indicator uses   Price Action   and its own filtering algorithm to determine the trend. This approach helps to accurately determine entry points and the current trend on any timeframe. The indicator uses its own algorithm for analyzing price changes and Price Action. Which gives you the advantage of recognizing, without delay, a new nascent trend with fewer false positives. Trend filtering conditions can be selected in the settings individually for your trading style. The indicator
55 USD
"The trend is your friend" is one of the best known sayings in investing, because capturing large trendy price movements can be extremely profitable. However, trading with the trend is often easier said than done, because many indicators are based on price reversals not trends. These aren't very effective at identifying trendy periods, or predicting whether trends will continue. We developed the Trendiness Index to help address this problem by indicating the strength and direction of price trend
49 USD
This indicator is another variant of the famous powerful indicator Fibonacci-SS https://www.mql5.com/en/market/product/10136 but has different behaviour in placing Pending Order and TP Line. Automatically places Fibonacci retracement lines from the last highest and lowest visible bars on the chart with: An auto Pending Order (Buy/Sell). Taking Profit 1, Taking Profit 2 is pivot point and Taking Profit 3 for extended reward opportunity. The best risk and reward ratio. Simple and powerful indica
30 USD
This is a new strategy for SUPPLY DEMAND areas It is based on a calculation using the tick volume to detect the big price action in market for both bear /bull actions this smart volume action candles are used to determine the supply and demand areas prices in between main supply and demand lines indicate sideway market  up arrows will be shown when prices moves above the main supply and the secondary supply lines Down arrows will be shown when prices moves below the main demand and the secondary
30 USD
Gartley Projection D
Oleksandr Medviediev
4.17 (6)
The indicator identifies the harmonic patterns (XABCD) according to developments of H.M.Gartley ( "Profits in the Stock Market" , 1935г). It projects D-point as a point in the perspective projection (specify ProjectionD_Mode = true in the settings). Does not redraw. When a bar of the working timeframe closes, if the identified pattern point has not moved during Patterns_Fractal_Bars bars, an arrow appears on the chart (in the direction of the expected price movement). From this moment on, the ar
300 USD
Requirements Optimized to work with   EURUSD-EURCHF-USDJPY, AUDUSD-CADJPY-AUDNZD, CHFJPY-NZDJPY-NZDUSD For timeframe 4H. *(Minimum recommended deposit is $300 for each Pair) for initial lot set to 0.10, My favorite Pair are (CHFJPY-NZDJPY-EURUSD-AUDNZD-USDJPY) Warning it will be SALE only 5 Copys at 60$ Then it will be update up to 200$  You can use it the way it is, For new Set Files will be add on (Comments) ECN broker with low spread is recommended to get better results. Setup is
60 USD
The RTrends indicator does two things: first, it automatically draws the layout of the price chart by plotting trend lines and, secondly, it produces bearish and bullish signals. The layout reflects the fractal nature of the market. Trends from different time horizons are applied simultaneously on the chart. Thus, from a single chart a trader can see trend lines of higher timeframes. The lines, depending on the horizon, differ in color and width: the older the horizon, the thicker the line is. T
60 USD
Introduction to X3 Chart Pattern Scanner X3 Cherart Pattern Scanner is the non-repainting and non-lagging indicator detecting X3 chart patterns including Harmonic pattern, Elliott Wave pattern, X3 patterns, and Japanese Candlestick patterns. Historical patterns match with signal patterns. Hence, you can readily develop the solid trading strategy in your chart. More importantly, this superb pattern scanner can detect the optimal pattern of its kind. In addition, you can switch on and off individu
250 USD
Tunafish EA MT4
Ismaele Daniele Lodetti
Tunafish EA is the most efficient EA on my profile. I spent a lot of time and effort to make this software sophisticated with possibilities of high potential returns while keeping the drawdown below 25%. The algorithms of the robot provide investors of any level of training with an investment opportunity that is both safe and aggressive. Tunafish EA imitating the work of the brain, capable of learning and adapting to changing conditions and predicting situations. When applied to trading in fina
69 USD
Free Market structure zig zag to assist in price action trading the screenshots describe how to use and how to spot patterns new version comes with alerts, email alert and  push notification alert can be used on all pairs  can be used on all timeframes  you can add additional confirmation indicators the indicator shows you your higher high and low highs as well as your lower lows and lower highs  the indication makes price action analysis easier to spot.
FREE
The Th3Eng PipFinite indicator is based on a very excellent analysis of the right trend direction with perfect custom algorithms. It show the true direction and the best point to start trading. With StopLoss point and Three Take Profit points. Also it show the right pivot of the price and small points to order to replace the dynamic support and resistance channel, Which surrounds the price. And Finally it draws a very helpful Box on the left side on the chart includes (take profits and Stop loss
89 USD
Elliott Wave Trend was designed for the scientific wave counting. This tool focuses to get rid of the vagueness of the classic Elliott Wave Counting using the guideline from the template and pattern approach. In doing so, firstly Elliott Wave Trend offers the template for your wave counting. Secondly, it offers Wave Structural Score to assist to identify accurate wave formation. It offers both impulse wave Structural Score and corrective wave Structure Score. Structural Score is the rating to sh
200 USD
Noize Absorption Index - is the manual trading system that measures the difference of pressure between bears forces and bulls forces. Green line - is a noize free index that showing curent situation. Zero value of index shows totally choppy/flat market.Values above zero level shows how powerfull bullish wave is and values below zero measures bearish forces.Up arrow appears on bearish market when it's ready to reverse, dn arrow appears on weak bullish market, as a result of reverse expectation. S
199 USD
このプロダクトを購入した人は以下も購入しています
今なら $147 ($602 オフ) - 無制限のアカウント - 次のアップデートで価格が上がります - 5 つ星のレビューを残すことを忘れないでください RelicusRoad ユーザー マニュアル + トレーニング ビデオ + プライベート Discord グループへのアクセス + VIP ステータス 市場の新しい見方 RelicusRoad は、外国為替、先物、暗号通貨、株式、および指数の世界で最も強力な取引インジケーターであり、トレーダーに収益を維持するために必要なすべての情報とツールを提供します。初心者から上級者まで、すべてのトレーダーが成功するためのテクニカル分析と取引計画を提供します。これは、将来の市場を予測するのに十分な情報を提供する重要な取引指標です。意味をなさないチャート上のいくつかの異なる指標ではなく、完全な解決策を信じています.これは、信号、矢印 + 価格アクション情報を表示するオールインワンのインジケーターで、他に類を見ない非常に正確です。 強力な AI に基づいて、RelicusRoad は不足している情報とツールを提供して、あなたを教育し、
147 USD
現在26%オフ 初心者やエキスパートトレーダーに最適なソリューション! このインジケーターは、独自の機能と新しい計算式を取り入れた、ユニークで高品質、かつ手頃な価格のトレーディングツールです。たった1枚のチャートで28の為替ペアの通貨強度を読み取ることができます。新しいトレンドやスキャルピングチャンスの引き金となるポイントを正確に特定することができるので、あなたのトレードがどのように改善されるか想像してみてください。 ユーザーマニュアルはこちら  https://www.mql5.com/en/blogs/post/697384 これが最初の1本、オリジナルだ! 価値のないクローンを買わないでください。 特別な サブウィンドウの矢印で強い通貨の勢いを表示 GAPがあなたのトレードを導く! 基準通貨や気配値が売られすぎ・買われすぎのゾーン(外相フィボナッチレベル)にあるとき、個別チャートのメインウィンドウに警告表示。 通貨がレンジの外側から反落した場合、プルバック/リバーサルのアラート。 クロスパターンの特別なアラート 複数の時間枠を選択可能で、トレンドを素早く
148 USD
Advanced Supply Demand
Bernhard Schweigert
4.93 (295)
現在33%オフ 初心者にもエキスパートトレーダーにも最適なソリューション このインジケーターは独自の機能と新しい公式を多数内蔵しており、ユニークで高品質かつ手頃な取引ツールです。このアップデートでは、2つの時間枠ゾーンを表示できるようになります。より長いTFだけでなく、チャートTFとより長いTF(ネストゾーンを表示)の両方を表示できます。すべてのSupply Demandトレーダーの皆さんのお気に召すはずです。:) 重要情報の公開 Advanced Supply Demandの可能性を最大化するには、 https://www.mql5.com/ja/blogs/post/720245 にアクセスしてください。   エントリーまたはターゲットの正確なトリガーポイントを正確に特定できれば取引がどのように改善されるか想像してみてください。新しい基盤となるアルゴリズムに基づいて構築されているため、買い手と売り手の間の潜在的な不均衡をさらに簡単に特定できます。これは、最も強い需要と供給のゾーンと、過去のパフォーマンス(古いゾーンを表示)がグラフィカルに表現されるためです。これらの機能は、最適
148 USD
現在20%OFF! 初心者やエキスパートトレーダーのためのベストソリューション! このダッシュボードソフトウェアは、28の通貨ペアで動作しています。それは私達の主要な指標(高度な通貨の強さ28と高度な通貨インパルス)の2に基づいています。それは全体の外国為替市場の大きい概観を与えます。それは、すべての(9)時間枠で28の外国為替ペアのための高度な通貨の強さの値、通貨の動きの速度と信号を示しています。チャート上で1つのインディケータを使用して市場全体を観察し、トレンドやスキャルピングの機会をピンポイントで見つけることができたら、あなたのトレードがどのように改善されるか想像してみてください。 このインディケータには、強い通貨と弱い通貨の識別、潜在的な取引の識別と確認がより簡単になるような機能が搭載されています。このインディケータは、通貨の強さや弱さが増加しているか減少しているか、また、すべての時間枠でどのように機能しているかをグラフィカルに表示します。 新機能として、現在の市場環境の変化に適応するダイナミックなマーケットフィボナッチレベルが追加され、すでに当社のAdvan
199 USD
Ultimate Sniper Dashboard
Hispraise Chinedum Abraham
4.65 (23)
299ドルで割引中! 今後値上げの可能性あり! 下の説明を読んでください! 究極のスナイパーダッシュボードのための最高のエントリーシステム。究極のダイナミックレベル。(私の製品をチェックしてください) 究極のスナイパーダッシュボードはMT4多通貨テスト制限のため、ライブマーケットでのみ作動します。 究極のスナイパーダッシュボードをご紹介します。HA-Sniper、MA-Sniper、その他多くの特別なモードが含まれる最高の製品です。究極のスナイパーダッシュボードは絶対的な獣です! 初心者やエキスパートトレーダーにとって最高のソリューションです。もう二度と動きを見逃さない! シンプルさとピップを愛するトレーダーのために、特別な製品をご用意しました。シンプルでありながら、ダッシュボードは複数のカスタムアルゴリズムに基づき28の通貨ペアを監視し、すべての作業を行います。たった一つのチャートで、プロのように市場を読み解くことができます。もし、為替ペアが動き出したときに、その方向性を正確に特定することができれば、あなたの取引はどれほど改善されることでしょう。   当社のシ
299 USD
Ultimate Dynamic Levels
Hispraise Chinedum Abraham
4.88 (8)
現在、ホリデーディスカウントで399ドル! 今後値上がりする可能性があります。以下の説明をお読みください。 Ultimate Dynamic Levelsの紹介 - Ultimate Sniper DashboardのBESTエントリーインジケーター! 極めてローリスクなタイムリーエントリーと高RR!!! アルティメットスナイパーダッシュボードはこちら。 初心者はもちろん、プロのトレーダーにとっても最も重要な能力は、いつどこで相場が転換するかを正確に判断し、いかに安全に参入し、利益を得て退場するかを見極めることです。 アルティメット・ダイナミック・レベルズ・インディケーターは、相場が転換する可能性が最も高い場所を簡単に教えてくれるので、極めてローリスクなトレードを自信を持って行うことができ、同時にチャートをクリーンでシンプルに保ちながら、$$$を稼ぐことができるのです! アルティメット・ダイナミック・レベルズ・インディケーターは、複数の時間枠で重要な隠れたレベルを一度に見つけるユニークで強力なアルゴリズムを持っています。また、他の典型的なSRインジケーターのように、レベ
199 USD
XQ Indicator MT4
Marzena Maria Szmit
1 (1)
The signal conditions are a combination of three indicators, and XQ Forex Indicators only display  medium and long-term trends . The indicator's efficacy has been improved with the addition of a filter that blocks out false signals. The XQ Forex Indicator can be used on  FX pairs, CFDs, and Cryptocurrencies . There are two type of signals:  Buy or Sell and Big Long or Big Short It is possible to enable sending emails when a major trend-change signal is detected, as well as to display the alerts
179 USD
現在20%OFF! このダッシュボードは、複数のシンボルと最大9つのタイムフレームで動作するソフトウェアの非常に強力な部分です。 このソフトは、弊社のメインインジケーター(ベストレビュー:Advanced Supply Demand)をベースにしています。    Advanced Supply Demand ダッシュボードは、素晴らしい概要を提供します。それは示しています。  ゾーン強度評価を含むフィルタリングされた需給値。 ゾーン内/ゾーンへのPips距離。 ネストされたゾーンがハイライトされます。 選択されたシンボルの4種類のアラートを全ての(9)時間枠で提供します。 それはあなたの個人的なニーズに合わせて高度に設定可能です。 あなたの利益! すべてのトレーダーにとって最も重要な質問です。 市場に参入するのに最適なレベルはどこか? 成功のチャンスとリスク/リターンを得るために、強力な供給/需要ゾーン内またはその近くで取引を開始します。 損切りの最適な位置はどこですか? 最も安全なのは、強力な供給/需要ゾーンの下/上にストップを置くことで
199 USD
このインディケータは、当社の2つの製品 Advanced Currency IMPULSE with ALERT  +   Currency Strength Exotics . のスーパーコンビネーションです。 このインジケーターは全ての時間枠で作動し、8つの主要通貨と1つのシンボルの強弱のインパルスをグラフで表示します。 このインジケータは、金、エキゾチックペア、商品、インデックス、先物など、あらゆるシンボルの通貨強度の加速度を表示することに特化されています。金、銀、原油、DAX、US30、MXN、TRY、CNHなどの通貨強度の加速度(インパルスまたは速度)を表示するために、任意のシンボルを9行目に追加できる、この種の最初のものです。 新しいアルゴリズムに基づいて構築され、潜在的な取引の特定と確認がさらに容易になりました。これは、通貨の強さや弱さが加速しているかどうかをグラフィカルに表示し、その加速の速度を測定するためです。加速すると物事は明らかに速く進みますが、これはFX市場でも同じです。つまり、反対方向に加速している通貨をペアリングすれば、潜在的に利益を生む取
149 USD
Cycle Sniper
Elmira Memish
4.5 (32)
NEW YEAR SALE PRICE FOR LIMITED TIME!!! Please contact us after your purchase and we will send you the complimentary indicators to complete the system. Cycle Sniper is not a holy grail but when you use it in a system which is explained in the videos, you will feel the difference. If you are not willing to focus on the charts designed with Cycle Sniper and other free tools we provide, we recommend not buying this indicator. We recommend watching the videos about the indiactor and system before
200 USD
A. A2SR とは何ですか ?   * 先行テクニカル指標です (塗り直しなし、ラグなし)。 -- ガイダンス : -- https://www.mql5.com/en/blogs/post/734748/page4#comment_16532516 -- そして https://www.mql5.com/en/users/yohana/blog A2SR には、サポート (需要) とレジスタンス (供給) のレベルを決定する特別な手法があります。 ネットで見かける通常の方法とは異なり、A2SR は実際の SR レベルを決定する独自のコンセプトを持っています。 元の手法はインターネットから取得されたものではなく、インターネット上で公開されたこともありません。 A2SR は、取引スタイルに応じて SR レベルを自動選択します。 時間枠を変更しても、SR レベルはその位置にとどまります。 実際のSRは、使用する時間枠から取得されるわけではないため. A2SR には、取引のための完全な手段があります 。 実際のサポート (需要) とレジスタンス (供給) の真のコンセプト。
386 USD
MTF Supply Demand Zones
Georgios Kalomoiropoulos
4.81 (21)
次世代の自動化された需要と供給のゾーン。どのチャートでも機能する新しい革新的なアルゴリズム。すべてのゾーンは、市場の価格行動に従って動的に作成されています。 2種類のアラート --> 1) 価格がゾーンに達したとき 2) 新しいゾーンが形成されたとき もう 1 つの役に立たない指標はありません。実績のある完全な取引戦略を手に入れることができます。     新機能:     価格が需給ゾーンに達したときにアラートを出す     新しい需給ゾーンが作成されたときにアラートを発します     プッシュ通知アラート     ピップ単位のゾーン幅ラベル     MTF のもう 1 つのタイムフレーム。したがって、現在より 2 時間足高いのではなく、現在より 3 時間足し上に見えるようになります。     アラート/ゾーン/MTF 機能を有効/無効にするボタン あなたが得る利点:     取引から感情を取り除きます。     取引エントリをオブジェクト化します。     確率の高いセットアップで利益
149 USD
Your success as a forex trader depends on being able to identify when a currency or currency pair is oversold or overbought. If it is strong or weak. It is this concept which lies at the heart of forex trading. Without the Quantum Currency Strength indicator, it is almost impossible. There are simply too many currencies and too many pairs to do this quickly and easily yourself. You need help! The Quantum Currency Strength indicator has been designed with one simple objective in mind. To give you
279 USD
Congestioni
Stefano Frisetti
5 (1)
This indicator is very usefull to TRADE Trading Ranges and helps identify the following TREND. Every Trader knows that any market stay 80% of the time in trading ranges and only 20% of the time in TREND; this indicator has been built to help traders trade trading ranges. Now instead of waiting for the next TREND, You can SWING TRADE on trading ranges with this simple yet very effective indicator. TRADING with CONGESTIONI INDICATOR: The CONGESTIONI Indicator identify a new trading range and a
200 USD
発見が困難で頻度が少ないため、分岐は最も信頼できる取引シナリオの1つです。このインジケーターは、お気に入りのオシレーターを使用して、通常の隠れた分岐点を自動的に見つけてスキャンします。 [ インストールガイド | 更新ガイド | トラブルシューティング | よくある質問 | すべての製品 ] 取引が簡単 通常の隠れた発散を見つけます 多くのよく知られている発振器をサポート ブレイクアウトに基づいて取引シグナルを実装します 適切なストップロスおよび利益レベルを表示します 設定可能なオシレーターパラメーター カスタマイズ可能な色とサイズ バー単位でサイズ別に分岐をフィルタリング パフォーマンス統計を実装します 電子メール/音声/視覚アラートを実装します 幅広い市場の見通しを提供するために、異なるオシレーターを使用して、干渉なしで同じチャートにインジケーターを何度もロードできます。このインジケーターは、次のオシレーターをサポートしています。 RSI CCI MACD オスマ 確率的 勢い 素晴らしい発振器 加速器発振器 ウィリアムズパーセントレンジ 相対活力指数 特に外国為替市
175 USD
Trade system "PAX Multi TMA/HMA 8" it is a ready-made trading system for trading on any instrument and any timeframe. An experienced trader on one instrument can get a profit from 100% to 400% per day . Completely ready for manual trading and use in robots. Not redrawn. It is convenient to work on timeframes M30, H1, H4. Tested on metals, currency pairs, oil, international stocks, Russian stocks, cryptocurrencies, monetary and cryptocurrency indices. What the trading system cons
144 USD
Attention! Friends, since there have been many scammers on the Internet recently selling indicators called ForexGump, we decided to warn you that only on our page is the LICENSE AUTHOR'S VERSION of the INDICATOR sold! We do not sell this indicator on other sites at a price lower than this! All indicators are sold cheaper - fakes! And even more often sold demo versions that stop working in a week! Therefore, in order not to risk your money, buy this indicator only on this site! Forex Gump Scalpin
147 USD
An extremely convenient indicator that truly makes the process of making money on the exchange easy. It is based on the scientifically rigorous theory of the market developed by the author, the beginning of which is presented here .               The indicator calculates the most probable price movement trajectory and displays it on the chart. Based on the predicted price movement trajectory, the indicator calculates the direction of the position and the position of the take profit
139 USD
Of all the four principle capital markets, the world of foreign exchange trading is the most complex and most difficult to master, unless of course you have the right tools! The reason for this complexity is not hard to understand. First currencies are traded in pairs. Each position is a judgment of the forces driving two independent markets. If the GBP/USD for example is bullish, is this being driven by strength in the pound, or weakness in the US dollar. Imagine if we had to do the same thing
197 USD
This indicator recognizes all support and resistance levels. A number of unique high-performance techniques have been applied, which made the existence of this indicator possible. All formed channels are naturally visible: horizontal linear linear parabolic cubic (Polynomial 3 degrees - Wave) This is due to a bundle of approximating channels. The formed channels form "standing waves" in a hierarchical sequence. Thus, all support and resistance levels are visible. All parameter management is
177 USD
これはほぼ間違いなく、MetaTraderプラットフォームで見つけることができる最も完全な調和価格形成自動認識インジケーターです。 19種類のパターンを検出し、フィボナッチプロジェクションをあなたと同じように真剣に受け止め、潜在的逆転ゾーン(PRZ)を表示し、適切なストップロスとテイクプロフィットレベルを見つけます。 [ インストールガイド | 更新ガイド | トラブルシューティング | よくある質問 | すべての製品 ] 19の異なる調和価格形成を検出します プライマリ、派生および補完フィボナッチ投影(PRZ)をプロットします 過去の価格行動を評価し、過去のすべてのパターンを表示します この指標は、独自の品質とパフォーマンスを分析します 適切なストップロスとテイクプロフィットのレベルを表示します ブレイクアウトを使用して適切な取引を通知します すべてのパターン比をグラフにプロットします 電子メール/音声/視覚アラートを実装します スコット・M・カーニーの本に着想を得て、この指標は最も純粋で急を要するトレーダーのニーズを満たすように設計されています。ただし、トレードを
249 USD
THEQ Volumen
Luis Alberto Vazquez Carpio
5 (1)
THEQ Volumeは、正確なボリュームオシレーターを表示します。次のトレンドまたは起こりうるトレンド変化を取引するために使用できます。 THEQ Volumeには、THEQ Volume Arrows、シグナルとアラートを備えたインジケーター、および実際の/デモ、バックテストと最適化、または独自の戦略を作成するためのTHEQ VolumeEAも含まれています。 追加のインジケーターとロボットEAは、支払い後に別々に出荷されます。 THEQボリュームは再描画せず、ラグがなく、キャンドルが閉じても信号が消えることはありません。 また、準備が整い、市場に迅速に参入するための事前シグナルもあります。 マニュアルと最適な設定インジケーターとEAを使用して、必要なときにいつでもサポートとヘルプを利用できます。新しいバージョンは常に最初の支払いに含まれています。 チップ: -EURUSDペアとM5TFの過去5年間を最も正確な方法(ティック)でバックテストして、購入したものがスクリーンショットやビデオと同じであることを確認します。 -EAが履歴データを読み取らないことを確認します。 -デモアカウン
495 USD
Price Action Entry Alerts
Stephen Sanjeeve Sahayam
5 (2)
このインジケーターは、売買圧力についてすべてのバーをスクリーニングし、最大量の 4 種類のローソク足パターンを特定します。次に、これらのローソク足はいくつかの線形フィルターを使用してフィルター処理され、買いまたは売りのシグナルが表示されます。シグナルは、より高い時間枠の方向と組み合わせて、取引量が多い時間帯に取引される場合に最も効果的に機能します。すべてのフィルターはカスタマイズ可能で、独立して動作します。ボタンをクリックするだけで単一方向の信号を表示できます。 シグナルはあらゆる入力方法で機能します。価格アクションまたはインジケーターとあらゆる取引スタイル。スキャルピング、日中取引、またはスイング取引。 特徴: 信号は再描画されません。 飲み込みキャンドル、拒否キャンドル、拡張範囲キャンドル、ピンバーを識別します。 有効なシグナルごとに複数のエントリー、ストップロス、複数のテイクプロフィットレベルを表示します。 大容量セッションでフィルタリングします。 サポート/レジスタンスレベルとローソク足の構造でフィルターします。 MACD ヒストグラムでフィルターします。 クリーンス
145 USD
Currency Strength Meters are a great way to identify strong and weak currencies. With this CSM indicator attached to your chart, you will get a clear overlook over the 8 major currencies: USD, EUR, JPY, CAD, CHF, GBP, AUD, and NZD. Suggested timeframes to scan is: M15 - H1 - H4 - Daily  You can however just change timeframe to check in the settings. Bear in mind that scanning very low timeframes such as M1 will require a lot of resources and might make your mt4 terminal slow.  The strength s
149 USD
Advanced Currency Strength Indicator The Advanced Divergence Currency Strength Indicator. Not only it breaks down all 28 forex currency pairs and calculates the strength of individual currencies across all timeframes , but, You'll be analyzing the WHOLE forex market in 1 window (In just 1 minute) . This indicator is very powerful because it reveals the true movements of the market.  It is highly recommended to  analyze charts knowing the performance of individual currencies or the countries ec
149 USD
トレンドトレーディング は、タイミングのプルバックとブレイクアウトにより、市場で起こっているトレンドから可能な限り利益を得るように設計された指標です。確立されたトレンドの中で価格が何をしているかを分析することにより、取引の機会を見つけます。 [ インストールガイド | 更新ガイド | トラブルシューティング | よくある質問 | すべての製品 ] 自信を持って効率的に金融市場を取引する むち打ちにならずに確立されたトレンドから利益を得る 収益性の高いプルバック、ブレイクアウト、早期の逆転を認識する この指標は、独自の品質とパフォーマンスを分析します 複数時間枠のダッシュボードを実装します インジケーターは再描画されていません 電子メール/音声/視覚アラートを実装します 確立されたトレンドは多くの取引機会を提供しますが、ほとんどのトレンド指標はそれらを完全に無視しています。インジケーターの解釈はかなり簡単です: (1) トレンドの変化 (2) トレンドの方向への後退 (3) トレンドの方向へのブレイクアウト 赤いダッシュ は下降トレンド中の修正です 青いダッシュ は上昇ト
175 USD
Moonwalker
Cengiz Erkoyuncu
5 (6)
ムーンウォーカーMT4インジケーターは、レンコチャート上のトレンドトレーディング戦略を革命的に変えることができる強力なツールです。高度なアルゴリズムにより、市場のトレンドを追跡し、急激な変動や市場騒音をフィルタリングすることで、信頼性が抜群に高くなっています。これにより、市場を常に監視することなく、簡単かつ自信を持ってトレードできます。 他のインジケーターとは異なり、ムーンウォーカーは、過去の市場状況を正確に反映し、シグナルを逆行させることはないため、後戻りすることはありません。さらに、サウンドアラートやプッシュ通知も付属しているため、取引機会を見逃すことはありません。 取引を次のレベルに引き上げたい場合、ムーンウォーカーインジケーターとシームレスに連携するWhoopeeEAは、優れたオプションです。ご希望の場合は、WhoopeeEAを共有できます。 私たちの言葉だけでなく、説明ビデオをご覧いただき、ムーンウォーカーを実際に動かして、今日からトレンドトレーディング革命に参加してください!
250 USD
Take Your Trading Experience To the Next Level ! and get the exclusive TFSR-Analyzer for free !    So you have all these outstanding features  on up to 20 symbols and all timeframes in a smart and clear Design. Correct identification of the trends  in stock investments are pivotal and TrendFollowerSR ensures this perspective while displaying the correct trend on multiply timeframes to help you go long way as much as possible. The latest technology of the Indicator enables to track whether if
149 USD
Agreement: Before Buy/Rent, make sure you have read this product description, slide images and video in more details  ️ Indicator USER MANUAL, Trade setups, solving issues, etc please visit   https://www.mql5.com/en/blogs/post/750802 Exclusive All In One   --- ( My Own Strategy )   Approach to trading based on: Smart Money Concept | SMC Elliott Wave Pattern | SMR Smart Money Reversal Harmonic Patterns | HP Fibonacci Pivot Points | FPP Quarters Points |  RN Round Numbers Average Daily
189 USD
Please send me Direct message on MQL5 CHAT after purchasing the Indicator for Training and Installation Support There are some additional files that is important to use with the Indicator . So be sure to contact me after purchasing the Indicator So that I can add you for training and support . If you find any difficulty with installation then send me Direct message here So that I can connect with you via Anydesk or Teamview for the product installation. " Smart Order Block Indicator " to find
249 USD
作者のその他のプロダクト
Universal Indicator EA, your ultimate solution to automate your trading strategy without any coding requirements. This powerful expert advisor is designed to work with any indicator that gives Buy and Sell Signals, making it a versatile tool for traders of all levels. With Universal Indicator EA, you can easily read signals from both Indicator Buffers and Objects on the Chart. You can also test your indicator on the demo account before purchasing to ensure that the EA is compatible with your ind
169 USD
CyberZingFx RSI
Afsal Meerankutty
4.2 (10)
Custom Relative Strength Indicator with multiple timeframe selection About RSI The relative strength index is a technical indicator used in the analysis of financial markets. It is intended to chart the current and historical strength or weakness of a stock or market based on the closing prices of a recent trading period. Features Indicator gives alert when reached oversold or overbought levels Gives dot indication while reaching levels. Can set indicator bar alert intervals for alerts Can choo
FREE
CyberZingFx Volume
Afsal Meerankutty
4.76 (37)
CyberZingFx Volume Indicator is designed to help traders find market reversals with ease. This powerful tool uses a unique strategy that combines both volume and historical price to provide accurate signals for potential market reversals. The indicator displays volume BUY and SELL power values on the right side of the chart for both BUY and SELL. With customizable settings, you can set alerts at different levels to suit your trading style. The most recent alert value is displayed as Alert High,
FREE
CyberZingFx Trend Reversal Indicator - your go-to solution for accurate and reliable trend reversal signals. With its unique trading strategy, the indicator offers you Buy and Sell Arrow signals that do not repaint, making it a reliable tool for catching Swing Highs and Swing Lows. SCROLL DOWN TO VIEW SCREENSHOTS AND WATCH VIDEO ________________________________________________________________ Trading using CyberZingFx Trend Reversal is Simple Using the CyberZingFx Trend Reversal Indicator is e
FREE
Buffer Finder Tool
Afsal Meerankutty
4.75 (4)
CyberZingFx Buffer Finder Tool Developed for Finding Buffers of Indicator to use in Universal Indicator EA . This is Not an Indicator or EA CyberZingFx Buffer Finder Tool is utility tool designed specifically for MetaTrader 4 (MT4) users. It is a standalone application that helps you easily find the buffers of any MT4 indicator, allowing you to use them in your Universal Indicator EA. With the Buffer Finder Tool, you no longer have to search through the data window to find the buffers you need.
FREE
As every ZigZag Indicator this Indicator Repaints . So use this only combining with other indicators or strategy.  CyberZingFx ZigZag Arrow MT4 Indicator, is one of the best tool for traders looking to identify trend reversals in the markets. This powerful indicator uses the ZigZag method to help you identify key support and resistance levels, making it easier to spot significant changes in price and filter out short-term fluctuations. With CyberZingFx ZigZag Arrow, you can quickly and easi
FREE
Indicator captures the trend reversals with no-repaint Buy and Sell Arrow signals. CyberZingFx Trend Reversal Indicator - your go-to solution for accurate and reliable trend reversal signals. With its  advanced trading strategy , the indicator offers you Buy and Sell Arrow signals that do not repaint, making it a reliable tool for catching Swing Highs and Swing Lows in any market and any time frame. Indicator works on  any market  and  any time frames . __________________________________________
149 USD
フィルタ:
mgl5fjn
267
mgl5fjn 2023.03.06 13:55 
 

just to the point effektive in conjunktion with daily, weekly and monthly support and resist, very useful!

Trusow
313
Trusow 2022.07.30 21:27 
 

Beat indicator on the market. It cost $125 for a reason. Make the small investment and it will reward you. Use it wisely as it is great at predicting tops and bottoms too

deimy
493
deimy 2022.01.05 03:32 
 

One of the best Volume indicators

Oscar Gomez Fuente
185
Oscar Gomez Fuente 2021.12.27 13:56 
 

Amazing indicator!. Do you have anyupdate when it is going to be ready for MT5?

Juan Feliciano
1721
Juan Feliciano 2021.09.26 07:18 
 

Great tool , simply amazing

MILAD ORANGI
117
MILAD ORANGI 2021.06.28 19:22 
 

This tool is basically useful for professional traders and the programmer of this indicator is well updated and fixes the shortcomings. And you have to have a good understanding of the market to use, and I hope that in the future the scanner and the dashboard will be created in general. I used the general version for a while and it was satisfying. Of course, there are drawbacks to the benefits of this tool that are few and far between.

maykelmax
326
maykelmax 2021.05.25 22:22 
 

After installing the indicator in the demo version on my platform, I tested various settings of this indicator. After testing, I had no doubts about purchasing the full version. Now I do not trade without this indicator because with optimal settings I did not have a losing trade after the signal. (with time, it will probably appear because it is only the market). I highly recommend this indicator but use Fibonacci levels and good Pivot Points indicator for it. It also works with harmonic patterns. I could write a lot, but if you don't find out for yourself, my words will be useless. To sum up - a very good indicator, with a clear conscience I can say that I am a bit shocked that this is how it works. I recommend and give 10 stars in the review. and only 5 in the tag, because that's all I can select. Good luck and have a lot of green pips.

Jason Crossan
318
Jason Crossan 2021.04.27 16:17 
 

I find the indicator very useful for possible trend reversals. Could author provide settings listing. Trying to understand each setting parameter to customize usage

Florin Dumitru
191
Florin Dumitru 2021.02.25 11:23 
 

Is a good indicator along with other indicators for trend confirmation . Thank you Afsal for all ! You make a good job ! Good luck !

Energybias
131
Energybias 2021.02.22 14:40 
 

A very good indicator for seeing changes in direction

boro50
39
boro50 2021.02.15 11:10 
 

llevo tiempo utilizando este indicador en demo y da muy buenas entradas he comprado la version de pago mejor porque no deja el hueco del volumen lo da al momento lo recomiendo .

YHW1022221880
170
YHW1022221880 2021.02.04 13:53 
 

The metrics are pretty good

777Luckytrader777
47
777Luckytrader777 2021.02.04 01:07 
 

A very useful indicator. The combination with the trend indicator gives a good profit.

Uwe Schubert
868
Uwe Schubert 2021.01.27 08:49 
 

One of the best Volume indicators, hard to find indeed.

TheKraken101
107
TheKraken101 2020.07.28 12:30 
 

One of the best indicators I’ve seen, very good to implement in any strategy 👌

レビューに返信
バージョン 1.7 2023.03.13
Critical bug fix!
バージョン 1.6 2022.12.27
Bug fixes and improvements
バージョン 1.5 2021.07.08
Average Price Line added which gives early indication of price action dot signal.
Bug Fixes.
バージョン 1.4 2020.08.31
Show / Hide settings for Price Action Dot Signals
バージョン 1.3 2020.07.17
Added Alert for Price Action Dot Signals
バージョン 1.2 2020.07.15
* Dot Signals added for average price change at top and bottom levels.
* Default settings changed.