EZT Future Candles
- インディケータ
- Tibor Rituper
- バージョン: 1.0
- アクティベーション: 10
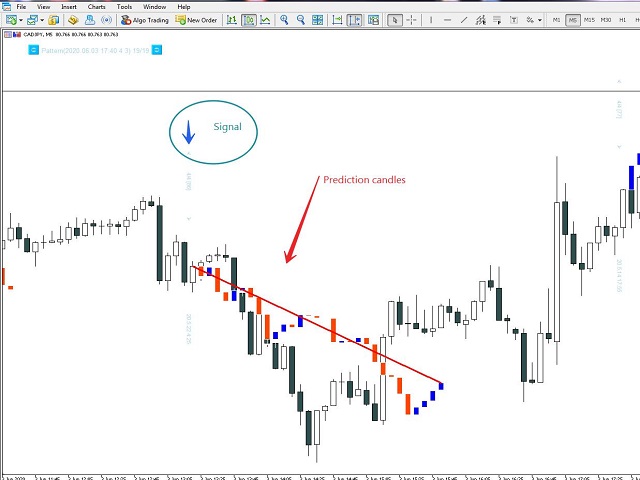
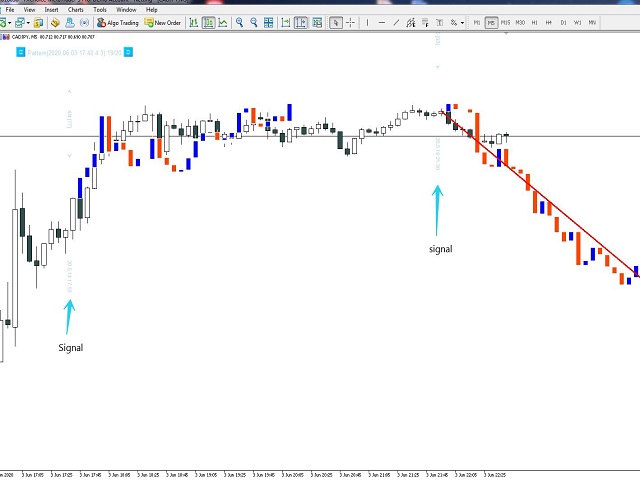
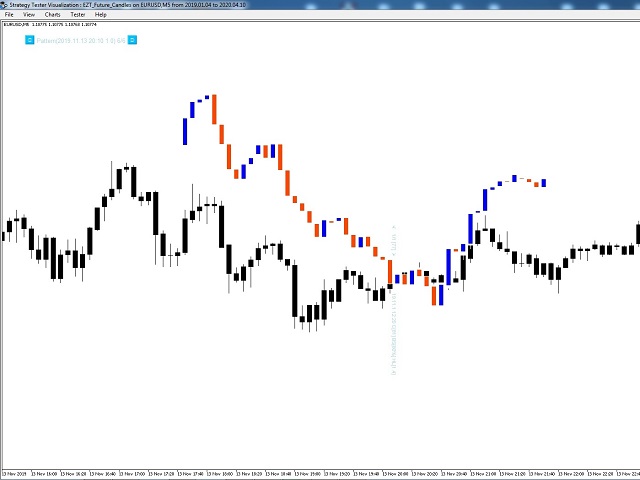
The indicator predict the future candles direction, by scanning past candle movement.
Based on the principal: “ The history repeat itself”. Programmed according to Kendall Correlation.
In the settings menu, different scanning options are available.
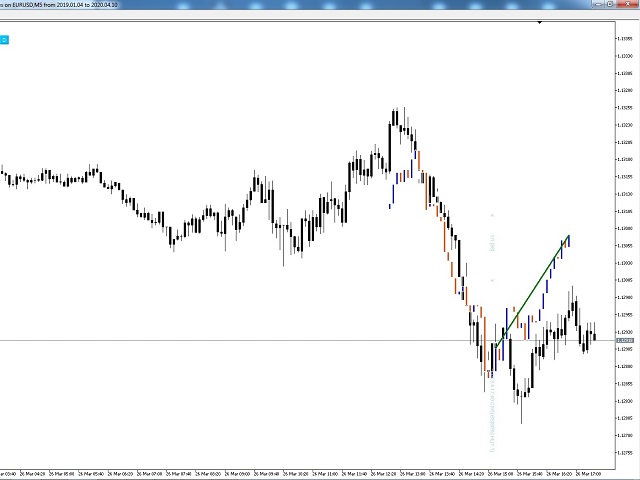
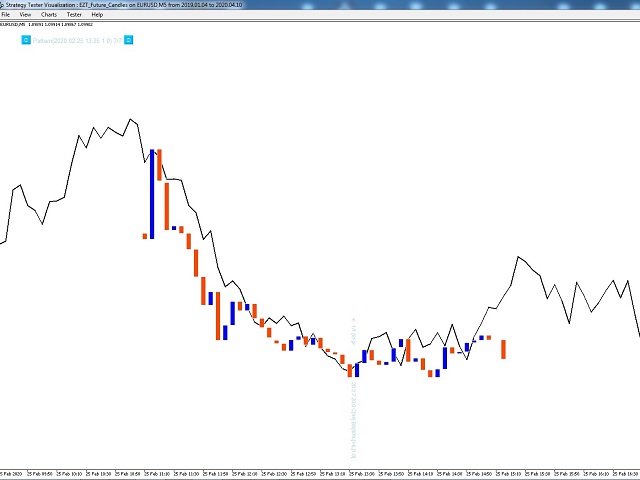
When the indicator find a match, start painting future candles from the current candle to the right, also from the current candle to the left as well, showing you the candle pattern what the actual signal is based on. The left side candle are optional, set it in the “ Draw Past Bars of the Pattern “ menu to true or false. If there is trend in those future candles, also optional, paint a trendline showing the probable direction.
Main menu:
· Indicator drawing period: You can choose how many candles back you like the indicator draw patterns what find in the past, this way you can examine the validity of the settings you choose.
· Test candles to Calculation: Number of candles to scan, to find a similar pattern to the actual last set of candle Pattern length.
· Draw Past Bars of the Pattern: True/False
· Candle Pattern Length: 5-100 candles. Choose the length of the pattern you looking for. The more candles you choose the less signals you might find.
· Use Trend Finder: true/false : drawing a trendline to the future candles if applicable.
· Trend Finder mode:Choose from 3 options when previous set to true.
· Uptrend Color:Up- trendline color
· Downtrend color: Down-trendline color
The following menu points will determine the signal you will receive.
Correlations
You can choose the 4 standard price options: close, open, high, low
After every price you can put a number from 1-100, that would be like a % of the similarity of the chosen pattern. The recommended number here is 80 %.
Ranges
Choose to compare of the Candle Pattern open/close or high/low range similarity.
Body size checking
This is the similarity in the candle body sizes
Directions of bodies similarity.
Bull /Bear candles in the given pattern
· Future candle count: 5-30. How many candles to draw in the future.
· Info text:All the chosen setting can be shown on the alert candle by vertically if set true.
· Period start vertical line: when set true, there will be a vertical line on the alert candle
· Navigator panel: When set to true there will be a navigator panel on the chart, you can jump to past candle alerts with the buttons.
· Alerts: Pop up, e-mail and push notification alert